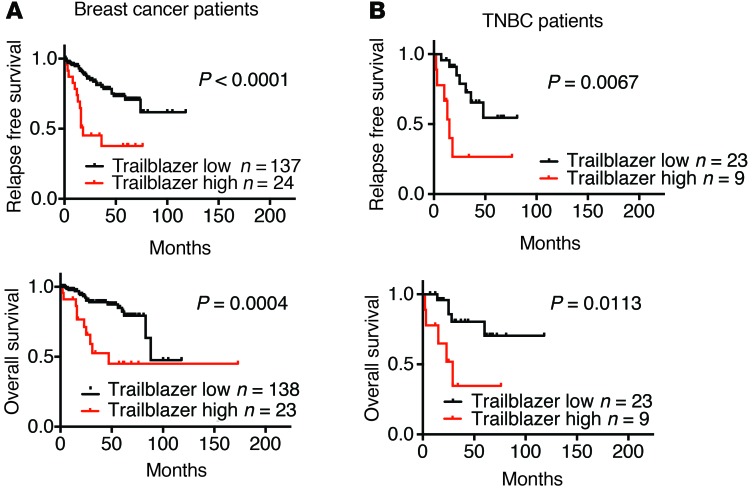
Figure 5. The elevated expression of genes required for trailblazer cell invasion correlates with poor patient outcome.
(A) Patients were classified as Trailblazer high and Trailblazer low using the 7 genes that were required for invasion in the SUM159 trailblazer and SUM229 trailblazer cells (DOCK10, DAB2, LPAR1, PPAP2B, ITGA11, VASN, and PDGFRA). Kaplan-Meier curves were drawn for both the Trailblazer-high and Trailblazer-low groups. Survival differences were compared using the log-rank (Mantel-Cox) test. (B) Kaplan-Meier survival curves for Trailblazer-high and Trailblazer-low TNBC patients. Survival differences were compared using the log-rank (Mantel-Cox) test.

