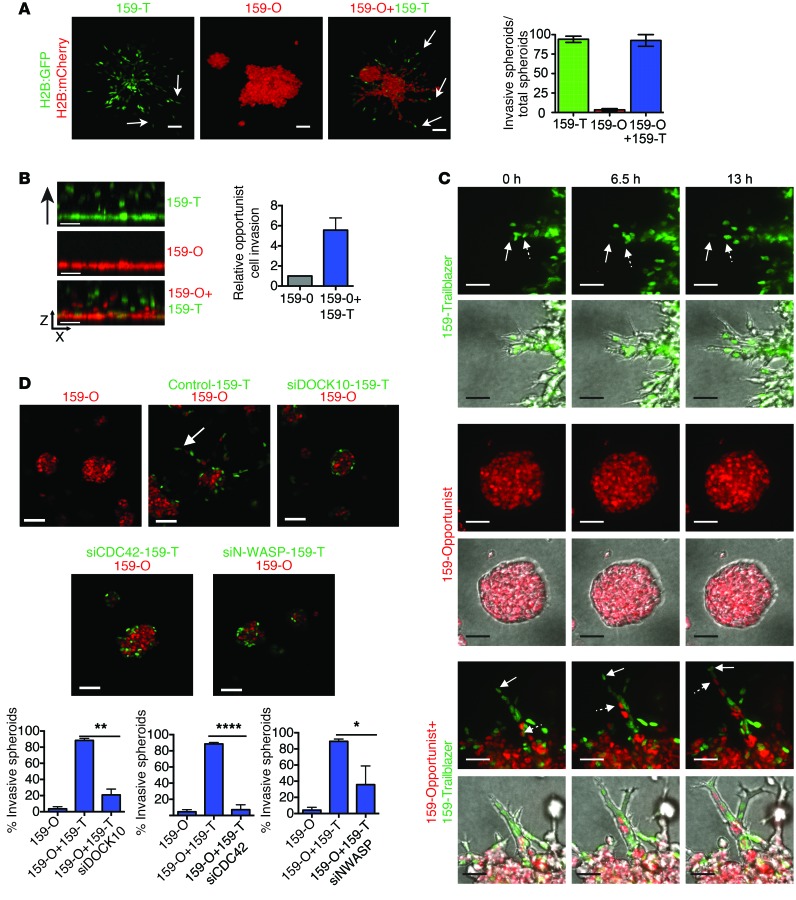
Figure 8. Trailblazer cells induce the collective invasion of opportunist cells through a commensal relationship.
(A) Representative images of SUM159 spheroids composed of 100% trailblazer, 100% opportunist, or 25% trailblazer/75% opportunist cells in organotypic culture. Spheroids were formed in hanging drops for 24 hours before plating in organotypic culture. Arrows identify invasive projections. Scale bar: 50 μm. Graph shows the percentage of invasive spheroids (mean ± range of 30 spheroids per condition, n = 2). (B) Representative x-z views of the invasion into ECM of 100% trailblazer, 100% opportunist, or 25% trailblazer/75% opportunist SUM159 cells. Fluorescent nuclei are shown. Scale bar: 50 μm. Graph shows the number of SUM159 opportunist cells that invaded ≥50 μm into the ECM (mean ± SD, n = 3). Unpaired Student’s t test. (C) Representative time-lapse images of spheroids composed of 100% trailblazer, 100% opportunist, or 25% trailblazer/75% opportunist cells. Solid arrows indicate cells leading invasion. Arrows with dashed tails indicate cells following into an existing projection (100 spheroids per condition total, n = 3). Scale bar: 25 μm. (D) SUM159 trailblazer cells were transfected with the indicated siRNAs for 24 hours before clustering with untransfected SUM159 opportunist cells in spheroids at 1:4 ratio. Spheroid clusters grown for 48 hours in organotypic culture and representative images are shown. Arrow identifies invasive projection. Scale bar: 50 μm. Graphs show the percentage of invasive spheroids (mean + SD, 50 spheroids per condition, n = 3). *P < 0.05, **P < 0.01, ****P < 0.0001, unpaired Student’s t test.

