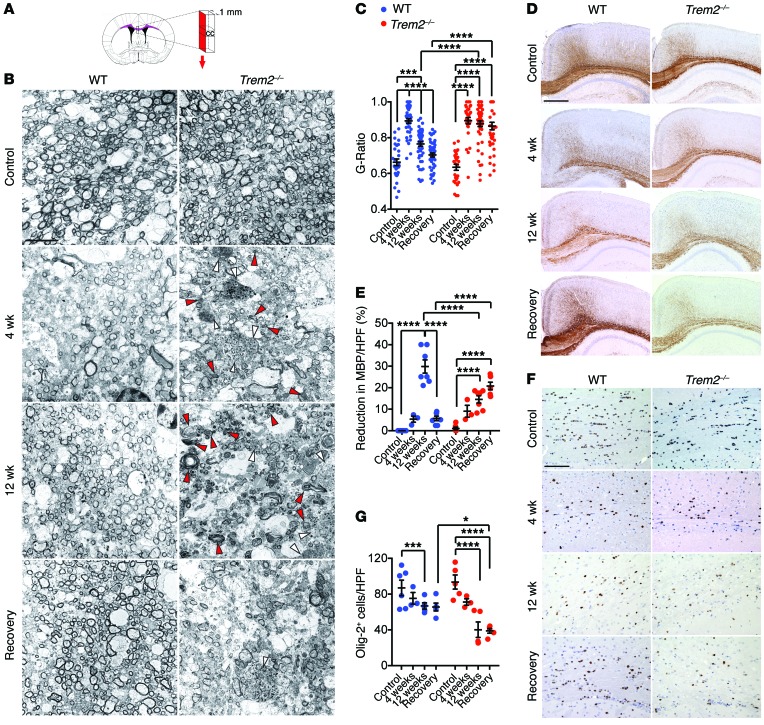
Figure 2. Trem2–/– mice show impaired remyelination after cuprizone treatment.
Mice were fed regular chow (control) or 0.2% cuprizone diet for 4 weeks, 12 weeks, or 12 weeks followed by 2 weeks of regular chow (recovery). (A–C) Myelination was assessed by TEM. (A) Strategy used for corpus callosum sectioning is indicated in red. (B) Representative images of corpus callosum in different treatments. Deposition of myelin debris (red arrowheads) and axonal spheroids (white arrowheads) is indicated in Trem2–/– mice. (C) Demyelination and remyelination after cuprizone feeding is measured by changes in G ratios. (D–G) Brain sections were stained for MBP and Olig-2 to detect myelin and ODCs, respectively. Representative images for MBP (D) and Olig-2 staining (F). Percentage reduction of MBP reactivity in the total white matter area (E) and frequencies of Olig-2+ cells (G). *P ≤ 0.05; ***P ≤ 0.001; ****P ≤ 0.0001, 2-way ANOVA. Original magnification, ×6000 (B); ×4 (D); ×20 (F). Scale bars: 5 μm (B); 500 μm (D); 100 μm (F). Data represent 2 to 3 mice (B and C) and 3 to 8 mice (D–G) per group. An average of 10 HPF per mouse were evaluated. Error bars represent mean ± SEM.

