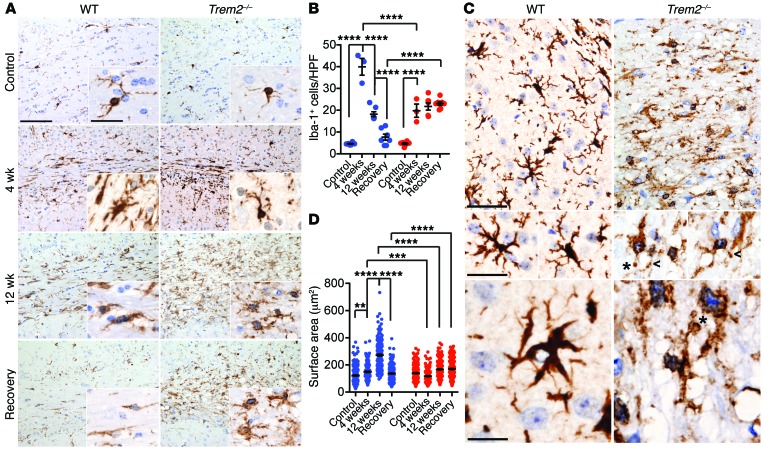
Figure 3. Trem2 deficiency impairs microglial response to demyelination.
Corpus callosum sections were stained with Iba-1 to detect microgliosis. (A) Representative images of Iba-1 staining. (B) Iba-1+ microglial frequencies per HPF. (C and D) Microglial morphology after cuprizone treatment. (C) Morphological assessment of WT and Trem2–/– microglia after 12 weeks of cuprizone treatment. Fragmentation, beading (arrowheads), and spheroid formation (asterisks) are indicated. (D) Surface area of Iba-1+ microglia is quantified. **P ≤ 0.01; ***P ≤ 0.001; ****P ≤ 0.0001, 2-way ANOVA. Original magnification, ×20 (A); ×60 (A, insets; C, middle and bottom images); and ×40 (C, top images). Scale bars: 100 μm (A); 30 μm (C, middle and bottom images); 50 μm (C, top images). Data represent 3 to 8 mice (B) and 4 mice per group (D) for a total of 2 experiments. An average of 10 HPF per mouse were evaluated for B. An average of 50 cells in 10 HPF per mouse were evaluated for D. Error bars represent mean ± SEM.

