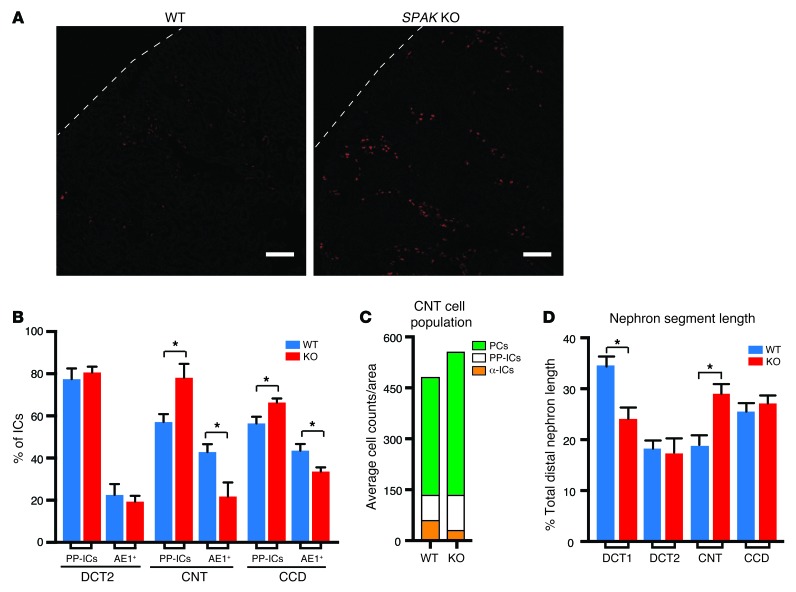
Figure 5. Cellular remodeling process replaces α-ICs with PP-ICs and expands CNT with PCs in SPAK KO mice.
(A) Immunolocalization of PP-ICs (pendrin, red) in the kidney cortex of WT and SPAK KO mice. Scale bars: 100 μm. (B) Relative number of IC subtypes (β- and non-α/non-β ICs [PP-ICs] and α-ICs [AE1+]) in the late DCT (DCT2), CNT, and CCD. For these studies, calbindin and AQP2 were used to identify nephron segments (calbindin alone = DCT2; calbindin plus AQP2 = CNT; AQP2 alone = CCD). Data represent the mean ± SEM. n = 4 animals per group. *P < 0.05 by 2-tailed t test for WT versus KO. (C) Quantitative summary of CNT cell subtype counts (numbers of PCs, α-ICs, and PP-ICs per unit area are plotted in the stacked diagram). (D) Morphometric length measurements of DCT1, DCT2, CNT, and CCD in WT and SPAK KO mice. Data represent the mean ± SEM. n = 5 animals per genotype. *P < 0.05 by 2-tailed t test for WT versus KO. (DCT, identified by the presence of parvalbumin and NCC; DCT2, identified as calbindin- and NCC-positive tubules; CNT, identified as calbindin- and AQP2-positive tubules; and CCD, identified as calbindin-negative, AQP2-positive tubules).

