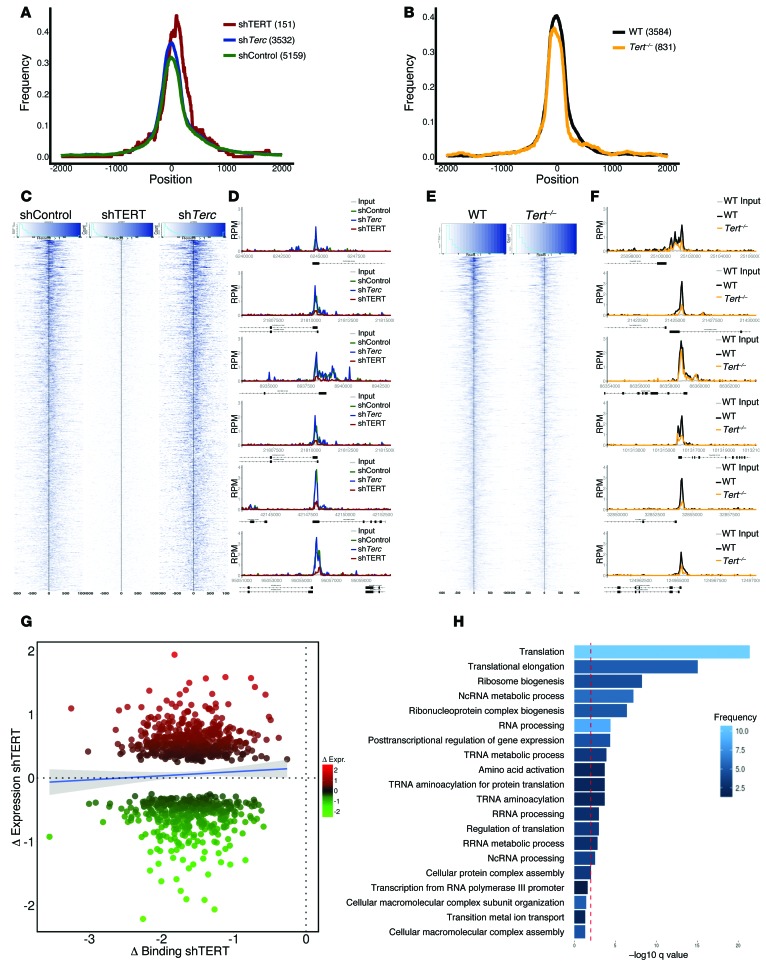
Figure 3. Genome-wide effect of TERT on MYC binding to target promoters and expression of MYC-regulated target genes.
MYC ChIP-Seq was performed in (C) P493 shControl, shTERT1, and shTerc or EμMYC Tert+/+ and EμMYC Tert–/– cells. (A and B) Peak profile centering on the transcriptional start site. Peaks were normalized to a width of 300 bp, and the frequency of binding events (1 equals all events) was calculated at each distance to the transcriptional start site. (C and E) Read density profile plots focusing on the transcriptional start site of MYC-bound promoters. Read densities at all promoters bound by MYC within 500 bp around the transcriptional start site in (C) P493 shControl, shTERT1, and shTerc or (E) EμMYC Tert+/+ and EμMYC Tert–/– cells were calculated and plotted as a heat map of normalized, background subtracted reads per sample. The black line indicates the transcriptional start site. (D and F) Representative examples of MYC binding to selected promoters. RPM, reads per million. (G) Transcriptional outcome of altered MYC binding upon loss of TERT. Bound and differentially expressed promoters were identified in P493 shControl and P493 shTERT1 cells. The change in MYC binding in shTERT1 is indicated on the x axis as the log2-fold change (normalized, background subtracted read densities within 500 bp upstream and downstream of the transcriptional start site around the transcriptional start site). Changes in expression are represented as normalized log2-fold change values of the respective genes on the y axis. The blue line is a linear smooth with a 0.95 confidence interval, indicating the general trend of the data set. (H) Enriched GO categories of bound and differentially expressed promoters, as indicated in G. The red line indicates a q value of 0.01, as reported by DAVID.

