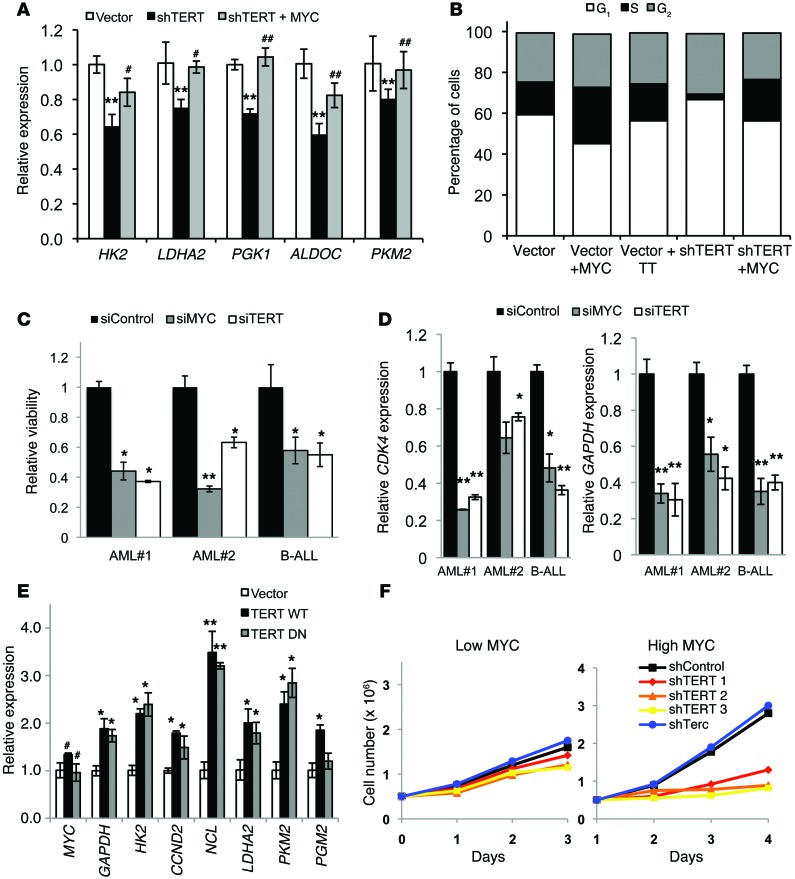
Figure 4. Phenotypic effects of TERT inhibition or depletion on MYC-dependent processes.
(A) Gene expression analysis of the indicated genes in P493 cells infected with vector, shTERT1, and shTERT1 + MYC (n = 3). **P < 0.01 vs. vector; #P < 0.05, ##P < 0.01 vs. shTERT, 1-way ANOVA with Tukey’s multiple comparison test. (B) Cell cycle profile of P493 cells infected with the indicated vectors. The cells were stained with propidium iodide and analyzed by FACS and FlowJo software for cell cycle phase distribution (n = 3). (C) Relative viability of independent primary patient cells (indicated on x axis) following MYC or TERT knockdown (n = 3 for each patient sample). AML, acute myeloid leukemia; B-ALL, B cell acute lymphoid leukemia. (D) Gene expression in primary patient samples (indicated on x axis) following MYC or TERT knockdown (n = 3 for each patient sample). (C and D) *P < 0.05, **P < 0.01, vs. siControl, Student’s t test. (E) Gene expression analysis in P493 cells infected with vector, TERT WT, and TERT DN (n = 3). *P < 0.05, **P < 0.01, #P > 0.05, vs. vector, Student’s t test. (F) Cell proliferation in P493 cells with knockdown of TERT and Terc under high-MYC and low-MYC conditions (n = 3).

