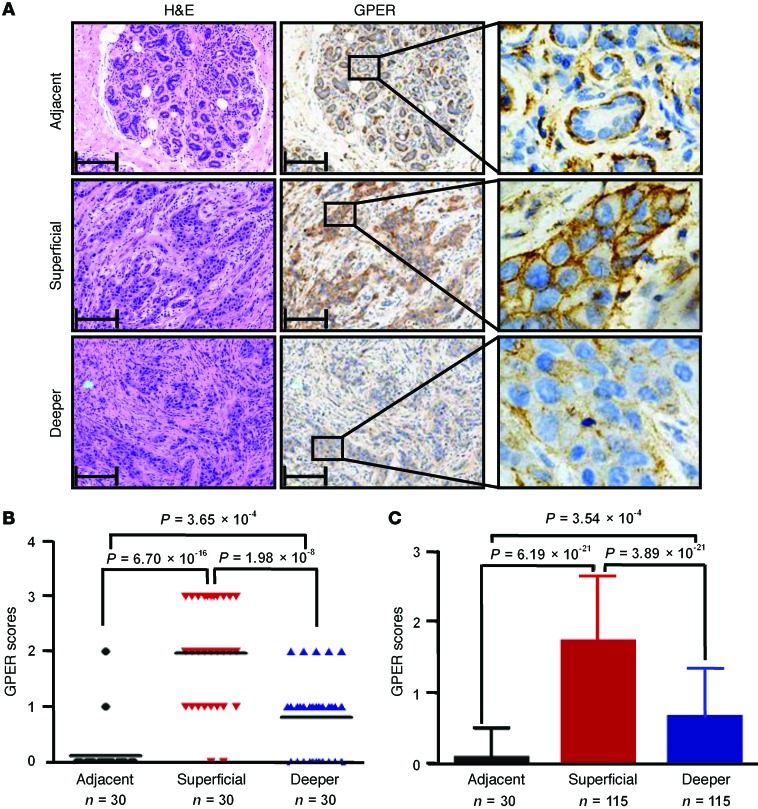
Figure 1. GPER expression is elevated in IDC of the breast.
(A) IHC detection of GPER expression in a representative breast IDC sample (including both the superficial and deeper areas) and a matched adjacent normal breast tissue. Tissue slices were H&E stained (left). The corresponding contiguous slices were stained for GPER (brown) and DNA (blue). Panels on the right show higher magnification (original magnification, ×400) of the boxed areas in the middle panels. Scale bars: 50 μm. (B and C) GPER expression was elevated in IDC. GPER staining intensity was quantified using the inForm System as described in Methods. Scores of GPER expression (0 = lowest, 3 = highest) from 30-matched pairs of carcinoma tissues and adjacent normal breast epithelium were analyzed by 1-way ANOVA with least-significant-difference (LSD) correction. Black lines within the data points represent the mean value (B). A total of 115 breast cancer tissues were compared with 30 adjacent normal breast epithelial tissues using 1-way ANOVA with LSD correction and are shown as column plots (C). Data are represented as the mean ± SD.

