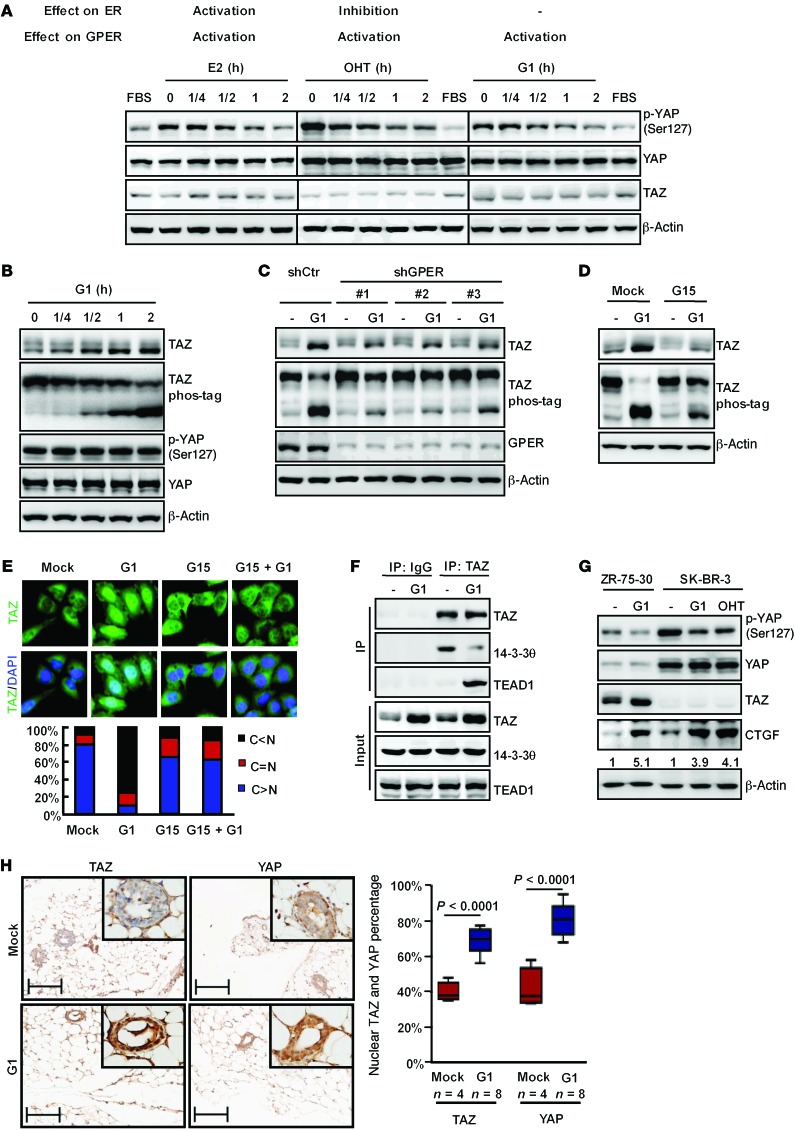
Figure 2. Stimulation of GPER activates YAP/TAZ.
(A) Activation of GPER induced YAP dephosphorylation. Serum-starved SK-BR-3 cells were stimulated with 100 nM β-estradiol (E2), 200 nM OHT, or 100 nM G1. Immunoblotting was performed. (B) GPER activation led to TAZ dephosphorylation and accumulation. ZR-75-30 cells were serum starved and stimulated with 100 nM G1. TAZ phosphorylation was assessed by phos-tag gels. TAZ quantification is summarized in Supplemental Table 2. (C and D) GPER mediated TAZ activation. GPER was inhibited either by shRNAs (C) or 500 nM G15 (D), and ZR-75-30 cells were treated and immunoblotted as indicated. (E) G1 stimulated TAZ nuclear localization via GPER. Serum-starved ZR-75-30 cells were treated with G1 and/or G15, and immunofluorescence staining for TAZ was performed. Quantifications of TAZ subcellular localization from 100 randomly selected cells are shown. C, cytoplasmic; N, nuclear. (F) G1 enhanced TAZ interaction with TEAD1 but inhibited TAZ interaction with 14-3-30. Serum-starved ZR-75-30 cells were treated with G1 for 2 hours and then subjected to immunoprecipitation with TAZ antibody. The coimmunoprecipitated TEAD1 and 14-3-30 were detected. (G) Activation of GPER increased the expression of the YAP/TAZ target gene CTGF. Serum-starved SK-BR-3 or ZR-75-30 cells were treated with G1 or OHT as indicated. The quantification of CTGF expression is shown. (H) G1 stimulated TAZ and YAP nuclear localization in mammary glands. Mice were injected with G1 as described in the Supplemental Methods and stained for TAZ and YAP. Scale bars: 50 μm. Original magnification, ×400 (insets). The percentage of nuclear TAZ and YAP was analyzed by Student’s t test. Horizontal lines represent the median; the top and bottom of the boxes represent the 75th and 25th percentiles. Data are representative of at least 3 independent experiments. p-YAP, phosphorylated YAP.

