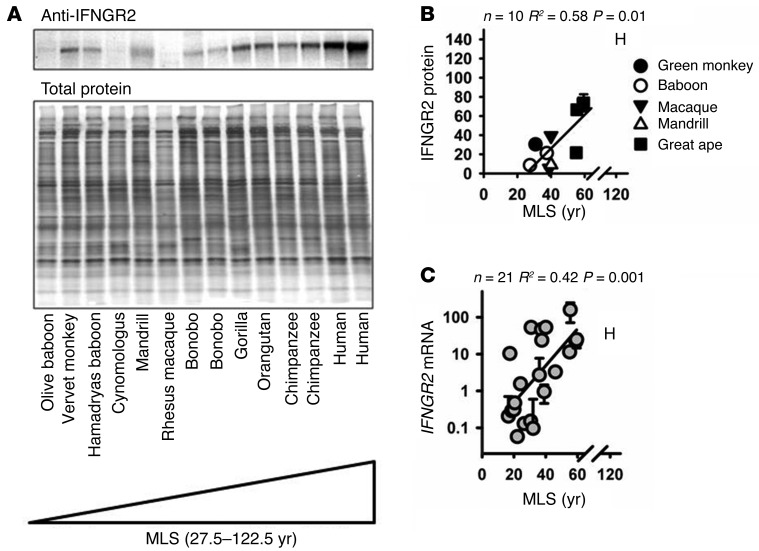
Figure 4. IFNGR2 protein and mRNA levels are elevated in cells from longer-lived primate species, relative to levels in shorter-lived species.
(A) Representative immunoblot. Samples were run on an SDS polyacrylamide gel and then developed using an antibody against IFNGR2 (ab175878 purchased from Abcam). Where multiple lanes are shown for the same species, this represents independent cell lines from different animals. (B) Scatter plot of IFNGR2 protein levels adjusted to total protein. (C) Scatter plot of relative IFNGR2 mRNA levels. Error bars, if present, represent the SEM of 2 cell lines derived from independent animals. Statistical significance was established using simple linear regression analysis.

