
Figure 6. a, b.
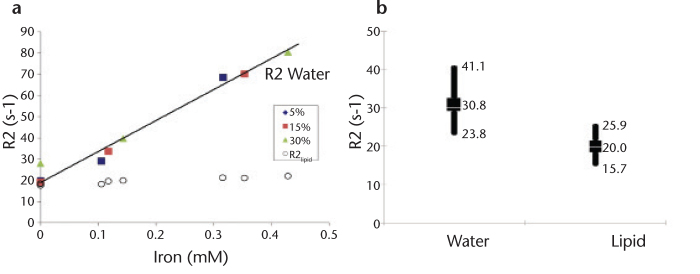
R2water and R2lipid are measurably different in phantoms and in vivo in the presence of lipid and iron. Correlation between MR spectroscopy-derived R2 values and known iron concentration in lipid/iron-doped phantoms reveals significant linearity with R2water (a). Conversely, measurements of R2lipid are relatively insensitive to changes in iron concentration. Note that the lipid content in the phantoms does not affect the linearity of R2water with iron. Initial in vivo data (n=24) quantifying R2 using MR spectroscopy indicates that there is a significant difference between R2water and R2lipid in a cross-section of patients with hepatic lipid (n=13), hepatic iron (n=3), or combined disease (n=8) (b). High, low, and average values are shown. Average R2lipid was 20.0±2.8 s-1, which closely follows the results in phantoms.