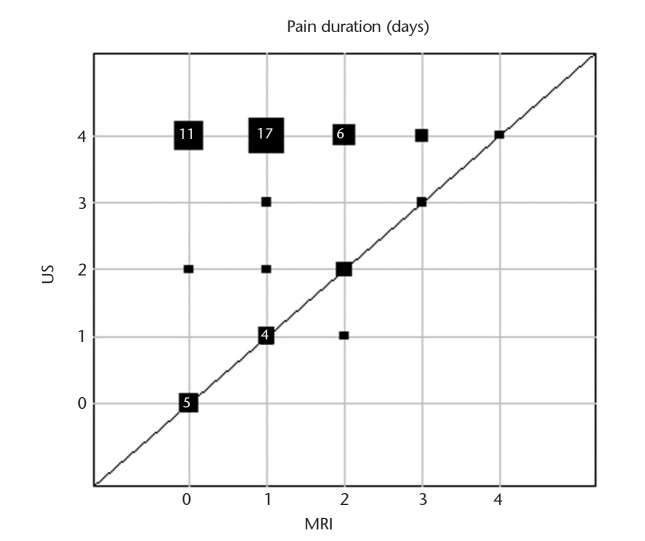
Figure 2.
Graphic representation of pain duration for intrapatient comparison of MRI-GB and TRUS-GB for those patients who provided information for both biopsy procedures. Square sizes represent the number of patients with the respective pair of values in a given position. For squares representing four patients or more, the number of patients with that pair of values is given inside the square (US, ultrasound; MRI, magnetic resonance imaging).

