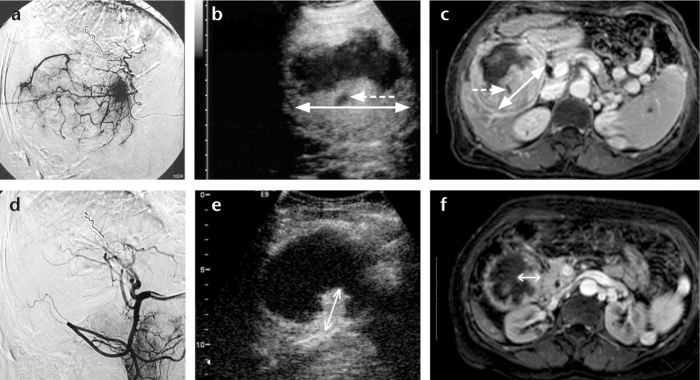
Figure 1. a–f.

Imaging of a large hepatocellular carcinoma prior to treatment (upper row images) and following the third transarterial chemoembolization (TACE) (lower row images). Angiographic images at the beginning of the first session of TACE, prior to embolization (a) and immediately after completion of the third session of TACE (d) show the almost complete elimination of tumor blush as a result of TACE. The contrast-enhanced ultrasonography (CEUS) images of the same tumor at baseline (b) and at follow-up, one month after the third session of TACE (e), show a significant decrease in the viable (enhancing) components of the tumor. Axial contrast-enhanced MR images of the tumor at baseline (c) and one month after the third session of TACE (f) confirm the decrease of tumoral enhancement. Double-headed arrows indicate the longest diameters of the enhancing parts of the tumors. In accordance with mRECIST guidelines, small necrotic areas (dotted arrows) within the main bulk of enhancing tumor were not included in the measurements. This patient also had two smaller lesions (not shown) with complete lack of enhancement one month after the third TACE (both on CEUS and MRI) and was diagnosed as a partial response.
