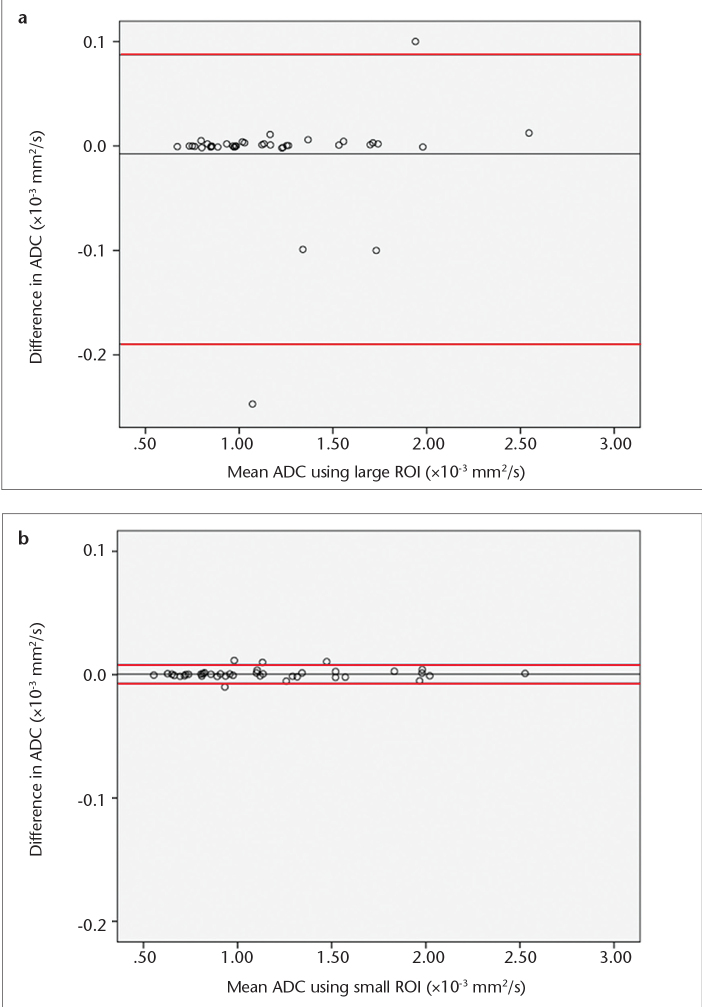
Figure 2. a, b.
Interobserver variability of ADC measurements using large (a) and small ROIs (b). The mean values of individual measurements for both observers are plotted on the horizontal axis. The differences of individual measurements are plotted on the vertical axis. Central line represents the mean absolute difference in ADC between the observers. Red lines represent the limits of agreement (1.96 times the standard deviation) below and above the mean absolute difference.

