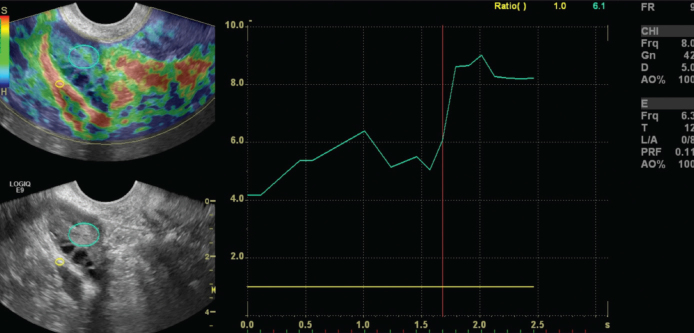
Figure 2.

Elastography image of a 24-year-old woman with PCOS and graphical representation of the strain ratio. The first region-of-interest (ROI) (A, small circle) was placed in the fallopian tube and the second ROI (B, large circle) was placed in the ovarian stroma. Strain ratio was calculated automatically as B/A. The x-axis represents time in seconds; y-axis represents strain.
