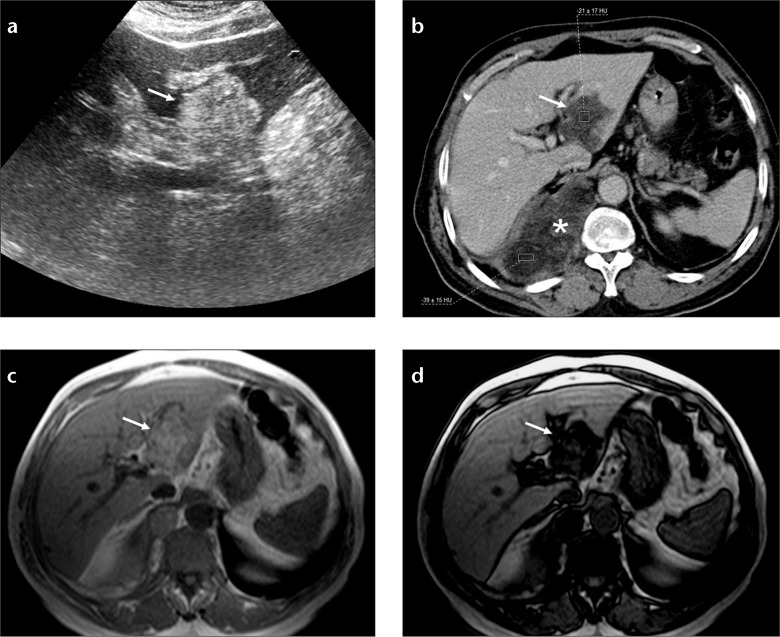
Figure 10. a–d.
Liposarcoma metastasis mimicking focal fat. Axial US image (a) of the liver shows a hyperechogenic mass at segments II and III of the liver (arrow). Axial CT image (b) shows fat density of the mass (arrow) and right thoracic primary mass (asterisk). In-phase (c) and out-of-phase (d) T1-weighted images show signal reduction in the fat containing mass due to coexistence of fat and solid parts (arrows).

