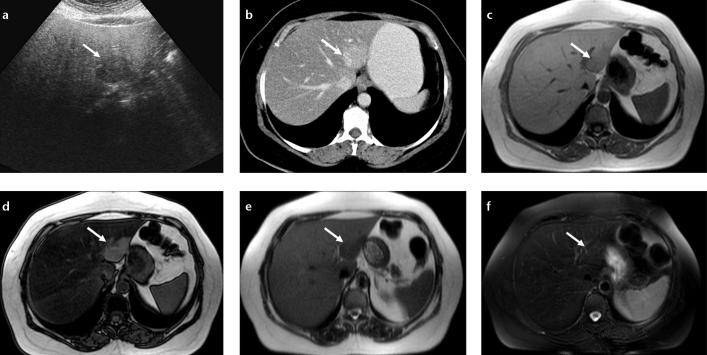
Figure 5. a–f.
Nodular focal fat spared area in a patient with melanoma. Axial US image (a) shows hypoechoic lesion (arrow) in a fatty liver and CT image (b) shows hyperdense area at the posterior aspect of segments II and III (arrow). In-phase (c) and out-of-phase (d) T1-weighted images show focal fat spared area by signal reduction in the whole liver parenchyma except for the fat spared area on the out-of-phase image (arrows). Severe steatosis causes increased signal of the liver on T2-weighted image (e) and the spared area (normal liver) appears hypointense; this contrast difference disappears on fat-saturated T2-weighted image (f).

