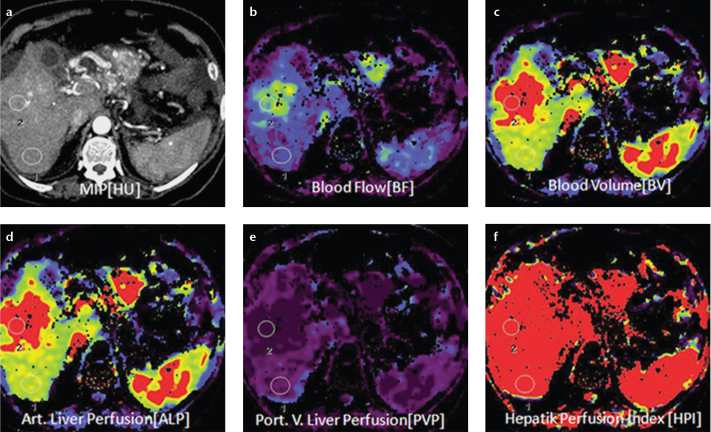
Figure 1. a–f.
Axial perfusion images (a) and functional CT perfusion map (b–f) of a 60-year-old man with hepatocellular carcinoma in the right lobe of the liver. The tumor manifests as a distinct range of colors compared with the background liver parenchyma. The functional map shows the wash out in the tumor. ALP, arterial liver perfusion; BF, blood flow; BV, blood volume; HPI, hepatic perfusion index; MIP, maximum intensity projection; PLP, portal liver perfusion.

