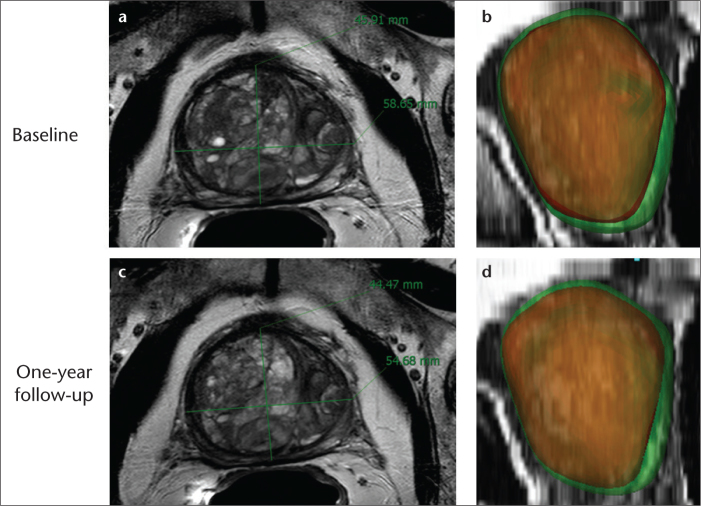
Figure 4. a–d.
Clinical case of a patient with BPH on finasteride (5-α reductase inhibitor) therapy. Axial T2-weighted MR images show prostate gland at baseline volume of 99 mL (a) and after one year on therapy, prostate volume was reduced to 89 mL (10% reduction) (c). The 3D-reconstructed MR images generated from the automated segmentation approach show the whole gland (green) and transitional zone (red) at baseline (b) and after one year on therapy (d).

