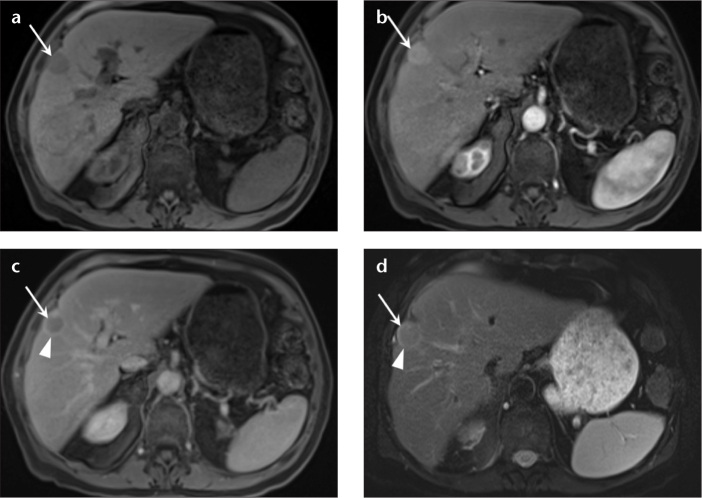
Figure 3. a–d.
A 85-year-old man with hepatitis C infection presents with liver mass. Precontrast (a) and arterial phase (b) 3D GRE images show arterial enhancement of the tumor in the right lobe of the liver (a, b, arrows). Delayed phase 3D GRE image (c) depicts washout (arrow) and capsule enhancement (arrowhead). T2-weighted fat-saturated single-shot image (d) shows mildly elevated T2 signal intensity within the tumor (arrow) and tumor capsule (arrowhead).

