
Fig. 3.
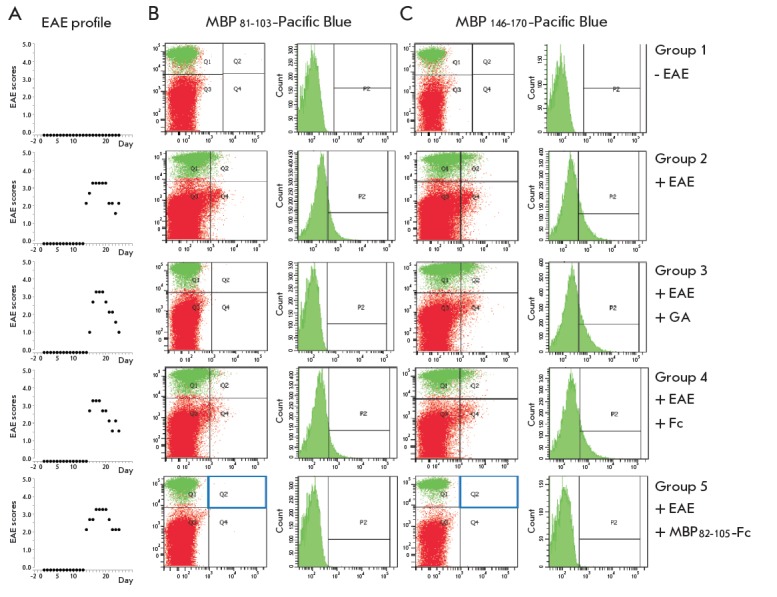
Plots representing the EAE development scores in mice from all experimental groups (A). FC analysis of isolated splenocytes for the presence of B cells specific for the fragments MBP81-103 (B) and MBP146-170 (C)
Official websites use .gov
A
.gov website belongs to an official
government organization in the United States.
Secure .gov websites use HTTPS
A lock (
) or https:// means you've safely
connected to the .gov website. Share sensitive
information only on official, secure websites.
Plots representing the EAE development scores in mice from all experimental groups (A). FC analysis of isolated splenocytes for the presence of B cells specific for the fragments MBP81-103 (B) and MBP146-170 (C)