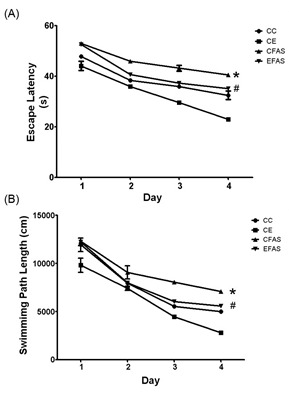
Figure 1. The escape latency (A) and distance traveled (B) to the hidden platform in spatial acquisition test over a 4-day trial period for the offsprings from CC, CE, CFAS, and EFAS treatment groups (n = 5-6). Data presented as mean ± SEM. * indicate P < 0.001 from CC values, # indicates P < 0.001 from CFAS group. CC, non-treated control group in standard housing; CE, non-treated control group in enriched environment; CFAS, prenatal alcohol exposure in standard housing; EFAS, prenatal alcohol exposure in enriched environmental.

