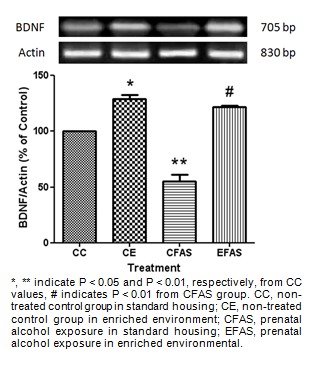
Figure 7. The mRNA expression of BDNF in the striatum. Total mRNAs were extracted from CC, CE, CFAS and EFAS treatment groups. The BDNF RT-PCR products were normalized to the level of actin expression within the same sample and represented as a percentage of the values of CC group, indicated by Mean ± SEM (n = 5-6).

