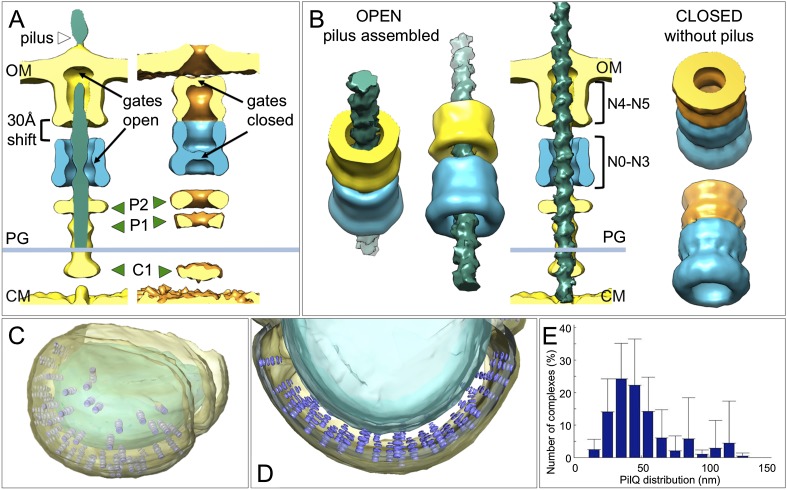
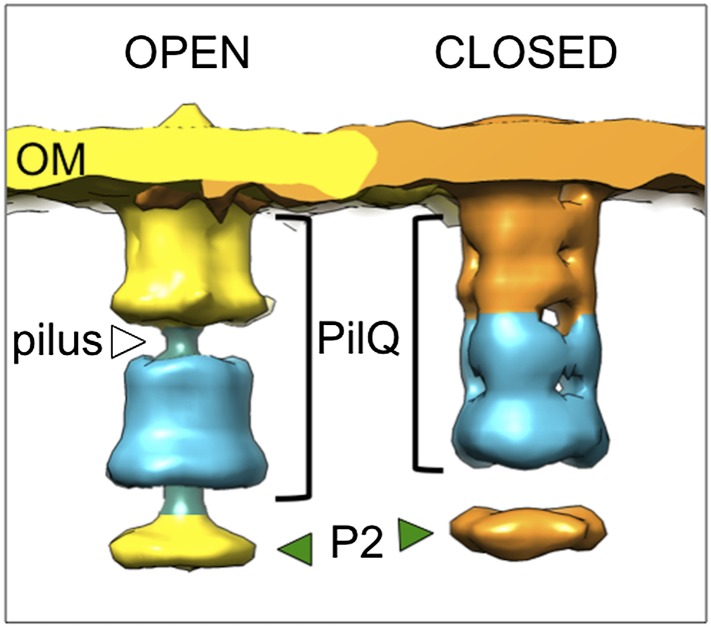
Figure 5. Changes between the open and closed state of the T4P machinery and its distribution in situ.
(A and B) Comparisons between the PilQ components of the T4P machinery reveal large conformational changes whereby both gates open and domains N0–N3 (now shown in blue for both states) shift by ∼30 Å towards the cytoplasm on pilus extrusion. Green arrowheads indicate additional protein densities (C1 = proximal to the cytoplasmic membrane, P1 = central periplasmic ring 1, P2 = central periplasmic ring 2). In (B) the structure of the T4P has been docked into the open state. OM, outer membrane; PG, peptidoglycan; CM, cytoplasmic membrane. (C and D) Docking subtomogram averages (purple) into the tomographic volume of a cell reveals the distribution of the closed T4P machinery in situ with respect to the outer membrane (pale yellow) and cytoplasmic membrane (blue). See Video 2 for details. (E) Averaged histogram of nearest-neighbour distance between protein complexes, calculated from 9 cells, with a total of 332 data points. Error bars indicate the standard deviation of the frequency distribution for each minimal distance.


