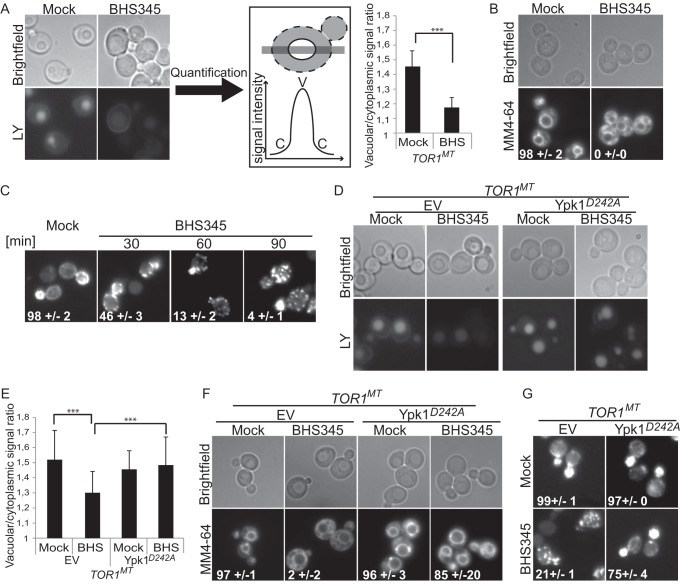
FIGURE 2.
TORC2 regulates actin polarization and endocytosis via Ypk1. A, left panel, and D, micrographs of TOR1MT cells treated for 90 min with Lucifer Yellow (LY) and either BHS345 (BHS) or drug vehicle as indicated. A, center panel, schematic demonstrating how Lucifer Yellow accumulation in the vacuole was quantified. Signal intensity of Lucifer Yellow was scored along a line that bisected the vacuole. The peak vacuolar signal (V) was divided by the minimum cytoplasmic signal (C) to generate the vacuolar/cytoplasmic signal ratio. A, right panel, and E, quantification of the vacuolar versus cytoplasmic accumulation of Lucifer Yellow in cells of the indicated genotypes after the indicated treatments. Two independent experiments were performed. Error bars represent mean ± S.E. Statistically significant differences are indicated (Student's t test) with p < 0.001 (***). B and F, micrographs showing MM4-64 accumulation in cells with the indicated genotype and after the indicated treatments. Cells were drug treated in SC media for 30 min, followed by 30-min incubation with 50 μm MM4-64 in YPD containing the drug. The values represent the percentage of cells with vacuolar staining ± S.E. C and G, micrographs of rhodamine phalloidin stained TOR1MT cells after the indicated treatments. The percentage of cells presenting polarized actin is indicated. Expression of hyperactive Ypk1D242A, but not an empty vector (EV), restores endocytosis (D, E, and F) and actin organization to BHS345-treated cells (C and G). A–G, BHS345 was used at 15 μm.

