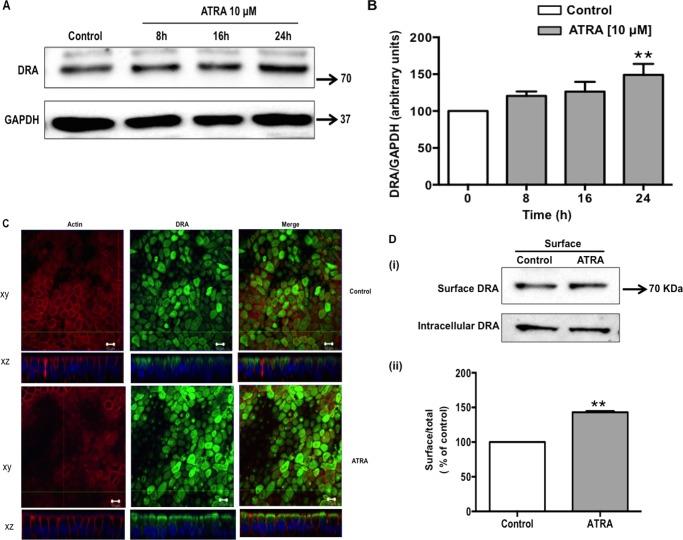
FIGURE 2.
ATRA induces DRA protein expression. Caco-2 cells were treated with 10 μm ATRA for 8, 16, and 24 h in serum-free cell culture medium. Control and ATRA-treated cell lysates were subjected to 7.5% SDS-polyacrylamide gel and transferred to nitrocellulose membrane. A, the blot was probed with rabbit anti-DRA or anti-GAPDH antibody. A representative blot of 3 separate experiments is shown. B, results of densitometric analysis are expressed as DRA/GAPDH levels. C, confocal microscopic localization of DRA (green) and Alexa Fluor 568-conjugated phalloidin (actin; red) and slow fade gold antifade reagent with DAPI labeled the nuclei (blue). ATRA (10 μm for 24 h) treated cells show an enhanced expression of the DRA on the apical surface compared with control. Representative image from 3 separate experiments is shown. D, Caco-2 monolayers were treated with ATRA (10 μm) in serum-free cell culture medium for 24 h and subjected to biotinylation at 4 °C using sulfo-NHS-SS-biotin. Surface and intracellular fractions were run on 7.5% SDS-PAGE followed by transfer to nitrocellulose membrane. The blot was immunostained with a rabbit anti-DRA antibody. (i) Representative blot of 3 different experiments is shown. (ii) Data were quantified by densitometric analysis and expressed as surface/total DRA (surface plus intracellular DRA). Values represent mean ± S.E. of 3 different experiments. **, p < 0.001 compared with control.

