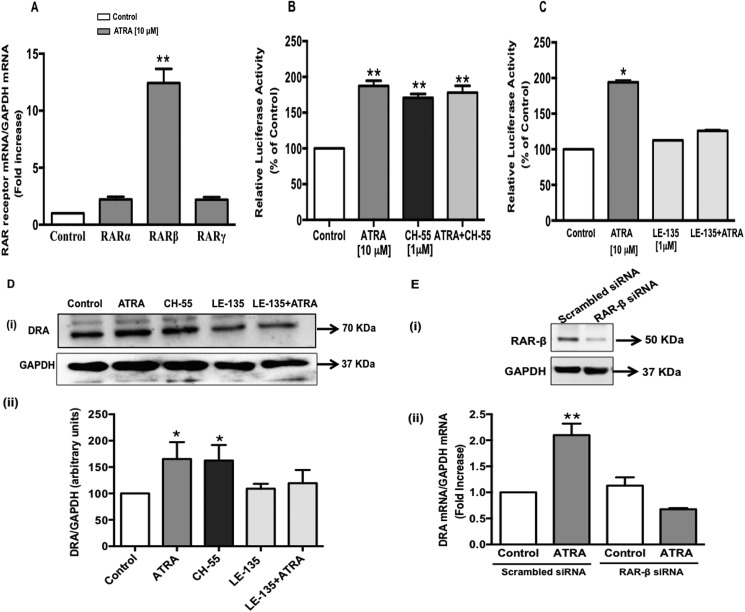
FIGURE 5.
RAR-β receptor is involved in the induction of DRA promoter activity. A, Caco-2 cells were treated with 10 μm ATRA for 24 h in serum-free cell culture medium. RNA was amplified utilizing RAR-α, -β, or -γ gene-specific primers for real-time PCR quantification. Data represent the relative expression of RAR-α, -β, or -γ normalized to the respective GAPDH mRNA (internal control) levels and are expressed as fold-changes compared with vehicle-treated controls. Values represent mean ± S.E. of 3 separate experiments performed. **, p < 0.001 compared with respective control. B and C, Caco-2 cells were transiently transfected with DRA luciferase promoter construct (p-1183/+114) along with pCMVβgal vector. B, after 24 h, cells were treated with RAR-β receptor agonist CH-55 (1 μm) or ATRA (10 μm) or both for 24 h. C, transiently transfected cells were pretreated with RAR-β receptor antagonist LE-135 (1 μm) for 60 min and then coincubated with ATRA (10 μm) for 24 h. Promoter activity was measured by luciferase assay. Values were normalized to β-galactosidase activity to correct for transfection efficiency. Results are expressed as % of control and represent mean ± S.E. of 3 separate experiments. *, p < 0.05; **, p < 0.001 compared with control. D, Caco-2 cells were treated with ATRA (10 μm) or CH-55 (1 μm) or LE-135 (1 μm) alone or in combination with ATRA for 24 h in serum-free media. Cell lysates prepared from the above treatment groups were subjected to 7.5% SDS-polyacrylamide gel and transferred to nitrocellulose membrane. (i) The blot was probed with rabbit anti-DRA or anti-GAPDH antibody. A representative blot of 3 separate experiments is shown. (ii) Results of densitometric analysis are expressed as DRA/GAPDH levels. Values represent mean ± S.E. of 3 different experiments. *, p < 0.05 compared with control. E, Caco-2 cells were transfected with scrambled or RAR-β-specific small interfering RNA (siRNA) for 48 h. (i) siRNA-mediated knockdown of RAR-β was confirmed by immunoblots with anti-RAR-β antibody. (ii) in a separate set of experiments, the cells were treated with 10 μm ATRA for an additional 24 h. Total RNA was extracted and quantitative real-time RT-PCR was performed utilizing primers specific for DRA. Data represent the relative expression of DRA normalized to the respective GAPDH mRNA (internal control) levels. Results are expressed as fold-changes in mRNA levels compared with control. Values represent mean ± S.E. of 3 separate experiments. **, p < 0.001 compared with control.

