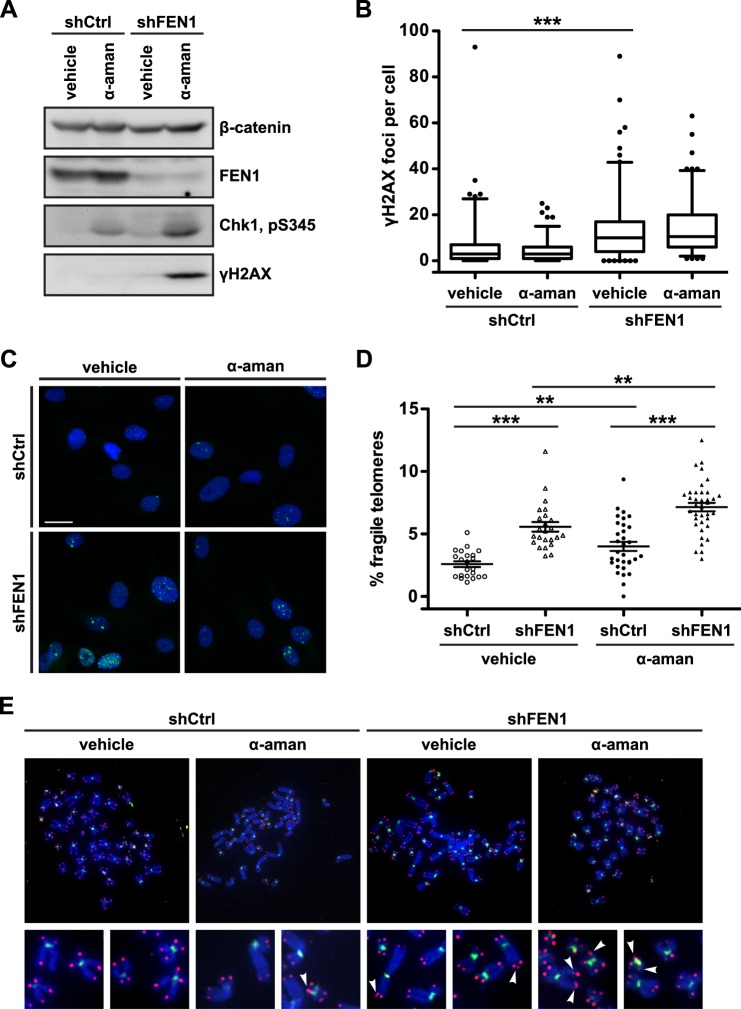
FIGURE 2.
FEN1 depletion and transcription inhibition induce replication stress, a DNA damage response, and telomere fragility. A, Western analysis of FEN1 expression, Chk1 phosphorylation (pS345), and H2AX phosphorylation (γH2AX) in control (shCtrl) or FEN1-depleted (shFEN1) cells treated with vehicle or α-amanitin (α-aman). β-catenin is shown as a loading control. B, quantification of γH2AX foci per cell. Two independent biological replicates were combined. The box marks the 25th to 75th percentile with the median marked by a horizontal line; whiskers mark the 5th and 95th percentiles, and dots represent values outside the 5–95 percentile range. p values were computed using a two-tailed Mann-Whitney U test (***, p < 0.001 relative to shCtrl). C, representative immunofluorescence images stained with a γH2AX antibody (green) and DAPI (blue) from BJ fibroblasts expressing a control hairpin (shCtrl) or depleted of FEN1 (shFEN1). Cells were treated with vehicle or α-amanitin (α-aman) as indicated. The scale bar (white) represents 25 μm. D, representative quantification of the rate of telomere fragility. p values were computed using a two-tailed Mann-Whitney U test (**, p < 0.01; ***, p < 0.001). Error bars represent standard error of the mean. E, representative metaphase chromosomes processed with FISH from BJ fibroblasts expressing a control hairpin (shCtrl) or depleted of FEN1 (shFEN1). Cells were treated with vehicle or α-amanitin (α-aman) as indicated. Centromeres are green, and telomeres are red. Arrowheads mark fragile telomeres in the magnified images.

