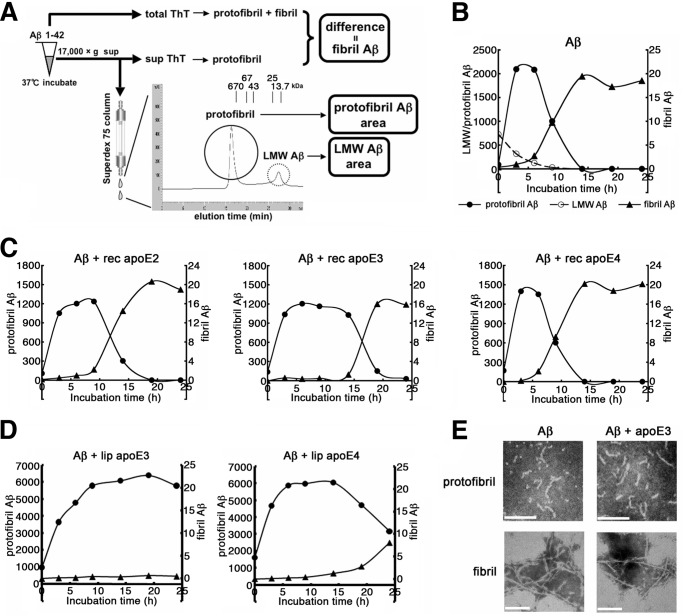
FIGURE 3.
Isoform-dependent effects of apoE on the formation of Aβ protofibrils and fibrils in vitro. A, schematic depiction of the method for the measurement of LMW, protofibril, and fibril forms of Aβ. The levels of LMW Aβ and protofibril Aβ are quantitated as areas corresponding to the ∼10-kDa peak and >100-kDa peak, respectively. The levels of Aβ fibrils are evaluated as the differences of ThT binding between samples prior to (total ThT) and after centrifugation (sup ThT). B, time course of the formation of LMW, protofibril, and fibril Aβ as monitored by SEC and ThT binding. 22 μm of Aβ(1–42) was incubated for 0, 3, 6, 9, 14, 19, or 24 h, and the levels of LMW Aβ (open circles) and protofibril Aβ (filled circles) were quantitatively evaluated by SEC and those of Aβ fibrils (triangles) by ThT binding, respectively. Representative data out of four independent experiments (that showed similar profiles) are shown. C, the effects of recombinant (rec) apoE on the formation of protofibril and fibril Aβ. 22 μm of Aβ(1–42) was incubated for 0, 3, 6, 9, 14, 19, or 24 h with 220 nm of rec apoE2 (left panel, n = 4), rec apoE3 (middle panel, n = 5), or rec apoE4 (right panel, n = 4), and the time course of the formation of Aβ protofibrils (circles) and fibrils (triangles) was monitored as in B. The starting time points of fibril formation were estimated to be 7.6, 13.9, and 5.2 h, respectively, in preparations incubated with rec apoE2, apoE3, and apoE4. The mean values are shown. D, the effects of the lipidated (lip) apoE particles on the formation of protofibril and fibril Aβ. 22 μm of Aβ(1–42) was incubated for 0, 3, 6, 9, 14, 19, or 24 h with 220 nm of lipid apoE3 particles (left panel, n = 4) or lipid apoE4 particles (right panel, n = 4), and the time course of the formation of protofibrils (circles) and fibrils (triangles) were monitored as in C. Fibril formation was observed starting at >24 h and 24 h of incubation, respectively, in preparations incubated with lipidated (lip) apoE3 and apoE4. The mean values are shown. E, negative stain electron microgram of protofibril and fibril forms of Aβ(1–42) incubated alone (left column) or with apoE3 (right column) for 6 h (protofibrils, upper row) and 24 h (fibrils, lower row), respectively. Scale bar, 100 nm.

