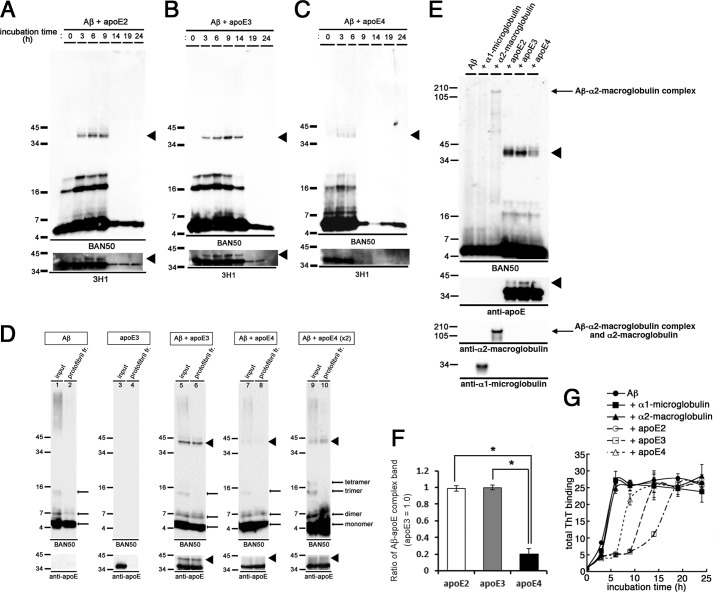
FIGURE 4.
Formation of SDS-stable Aβ-apoE complex in vitro. A–C, time course of formation of the SDS-stable Aβ-apoE complex. 22 μm of Aβ(1–42) was incubated for 0, 3, 6, 9, 14, 19, or 24 h with rec apoE2 (A), rec apoE3 (B), or rec apoE4 (C). After centrifugation, SDS-stable Aβ-apoE complex was monitored by immunoblot analyses with an anti-Aβ antibody (BAN50, upper panel) and an anti-apoE antibody (3H1, bottom panel). Arrowheads indicate the SDS-stable Aβ-apoE complex bands (n = 3). D, formation of SDS-stable Aβ-apoE complex in the Aβ protofibril fraction. Immunoblot analyses of isolated protofibrils without apoE (lanes 1 and 2), with rec apoE3 (lanes 5 and 6), with rec apoE4 (lanes 7–10), and of rec apoE3 alone (lanes 3 and 4) with an anti-Aβ antibody (BAN50, upper panels) and an anti-apoE antibody (bottom panels). Lanes 9 and 10 were loaded with double the amount of samples. Arrowheads indicate the bands corresponding to SDS-stable Aβ-apoE complex migrating at ∼40 kDa (n = 3). E, 22 μm of Aβ(1–42) was incubated alone (Aβ) or with rec α1-microglobulin, rec α2M, rec apoE2, rec apoE3, or rec apoE4 for 6 h. After centrifugation at 17,000 × g for 5 min, SDS-stable complex was monitored by immunoblotting analyses using an anti-Aβ antibody (BAN50, upper panel), an anti-apoE antibody (3H1, the second panel from the top), an anti-α2M antibody (the third panel from the top), and an anti-α1-microglobulin antibody (bottom panel). Arrowheads indicate ∼40-kDa bands corresponding to the SDS-stable Aβ-apoE complex, and the arrow indicates the SDS-stable Aβ-α2M complex migrating at ∼190 kDa. F, quantitative measurement of the band intensities in E. The mean values ± S.D. in three independent experiments are shown as ratios relative to the values of apoE3 as 1.0. *, p < 0.05. One-way analysis of variance was used. G, in vitro Aβ fibrillization assay in the presence of binding proteins. 22 μm of Aβ(1–42) was incubated in the absence (filled circles) or presence of rec α1-microglobulin (the molar ratio of Aβ/α1-microglobulin at 100:1, filled squares), rec α2M (the molar ratio of Aβ/α2M at 100:1, filled triangles), rec apoE2 (the molar ratio of Aβ/apoE2 at 100:1, open circles), rec apoE3 (the molar ratio of Aβ/apoE3 at 100:1, open squares), or rec apoE4 (the molar ratio of Aβ/apoE4 at 100:1, open triangles) for 0, 3, 6, 9, 14, 19, and 24 h, and then ThT fluorescence was measured. The mean values in three independent experiments are shown.

