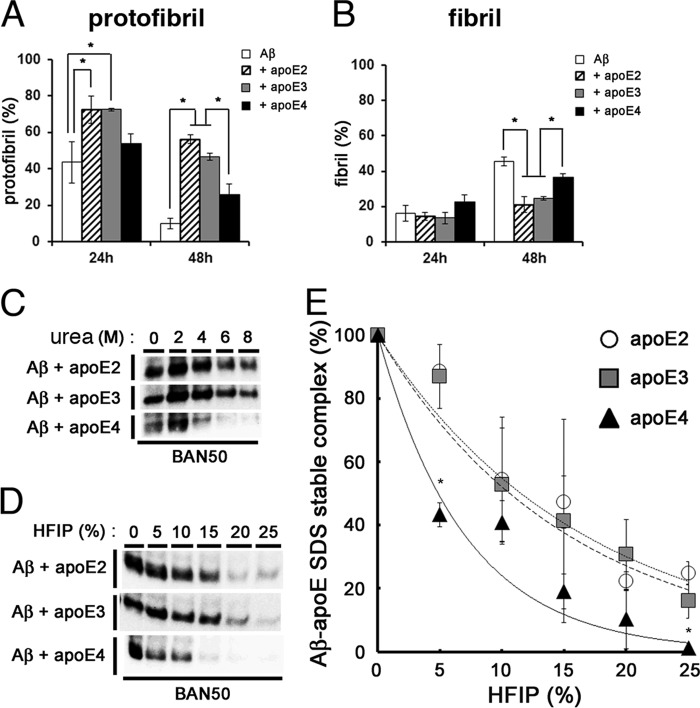
FIGURE 6.
Isoform-dependent effects of apoE on the stability of Aβ protofibrils. A and B, the effects of apoE on the stability of Aβ protofibrils (A) and formation of fibrils (B). Aβ protofibrils isolated by SEC were incubated alone (white column), with rec apoE2 (hatched column), with rec apoE3 (gray column), or rec apoE4 (black column) for 24 and 48 h. After centrifugation at 17,000 × g for 5 min, the levels of protofibrils were monitored by the ThT fluorescence of supernatants, and those of fibrils were determined by the difference in ThT fluorescence between samples before and after centrifugation. The percentage of levels of protofibrils (A) and fibrils (B) at 24 or 48 h that comprise those prior to incubation as 100% (mean values ± S.D. in three independent experiments) are shown. *, p < 0.05. One-way analysis of variance was used. C, stability of SDS-stable Aβ-apoE complex against urea. 22 μm of Aβ(1–42) was incubated for 6 h with rec apoE2, rec apoE3, or rec apoE4, followed by addition of urea at 0, 2, 4, 6, or 8 m of final concentrations and additionally incubated for 12 h. SDS-stable Aβ-apoE complex was detected by immunoblot analyses with an anti-Aβ antibody (BAN50). D, stability of SDS-stable Aβ-apoE complex against HFIP. 22 μm of Aβ(1–42) was incubated for 6 h with rec apoE2, rec apoE3, or rec apoE4, followed by addition of HFIP at 0, 5, 10, 15, 20, or 25% of final concentrations and additionally incubated for 12 h. SDS-stable Aβ-apoE complex was detected by immunoblot analyses with an anti-Aβ antibody (BAN50). E, quantitation of data in D. The levels of Aβ-apoE2 (circles), Aβ-apoE3 (squares), and Aβ-apoE4 (triangles) complexes after addition of indicated concentrations of HFIP were evaluated by densitometry. The mean values ± S.D. in three independent experiments are shown. *, p < 0.05. One-way analysis of variance was used.

