FIGURE 9.
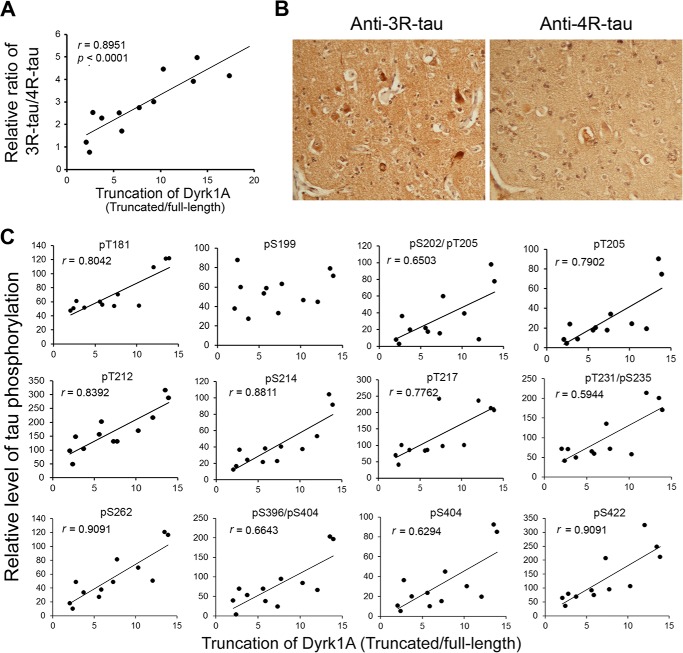
Levels of 3R-Tau and Tau phosphorylation directly correlate with truncation of Dyrk1A in AD brain. A, correlation of 3R-Tau/4R-Tau ratio (y axis) with Dyrk1A truncation (x axis) in AD brain. The level of Dyrk1A truncation in frontal cortices from 12 AD cases was plotted against the 3R-Tau/4R-Tau ratio. The correlation was analyzed by Spearman correlation analysis. B, immunohistochemical staining of sections from AD temporal cortex with anti-3R-Tau and anti-4R-Tau. Anti-3R-Tau (RD3) labels neurofibrillary tangles more than anti-4R-Tau (RD4). C, correlation between Dyrk1A truncation and site-specific phosphorylation of Tau. Levels of Dyrk1A truncation and Tau phosphorylation at individual phosphorylation sites in the frontal cortical homogenates from 12 AD cases were determined by Western blots (not shown). The levels of Tau phosphorylation at individual phosphorylation sites (y axis) were then plotted against the corresponding Dyrk1A truncation (x axis), and the correlation was analyzed by Spearman correlation analysis. A linear regression line is shown when the correlation reaches statistical significance (p < 0.05).

