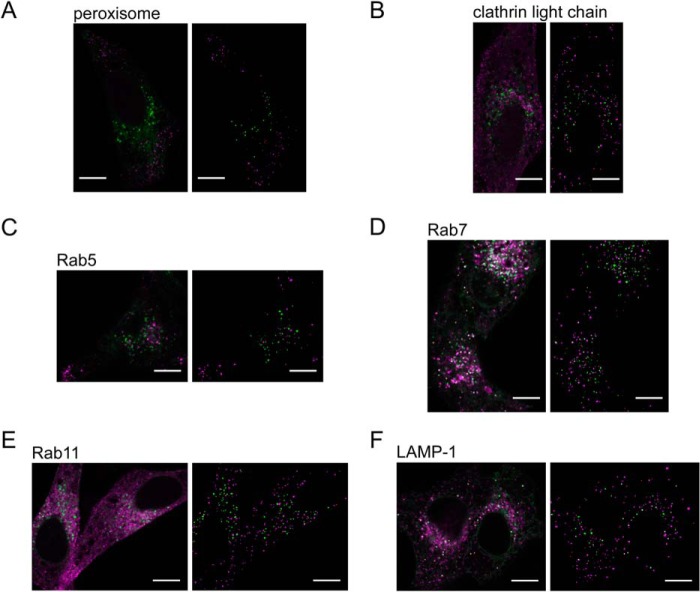
FIGURE 8.
Colocalization analysis between V5. 3ΔCT vesicles and subcellular markers. A–F, HeLa cells were co-transfected with the V5.3ΔCT expression plasmid and each subcellular marker and observed by confocal microscopy. Merged images of V5.3ΔCT (green) with each subcellular marker (magenta) are shown on the left. The colocalized pixels are shown in white with yellow outlines. Extracted vesicle images using ImageJ software are shown in the binary images on the right. The scale bar indicates 10 μm.

