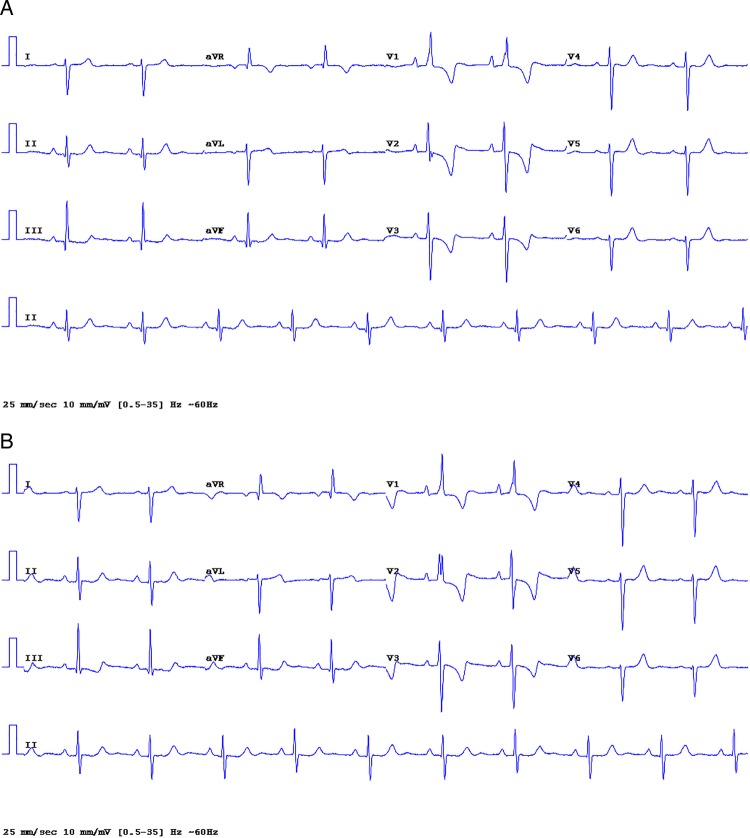
Figure 6.
(A) Standard 12-lead ECG from a patient with Eisenmenger syndrome. Marked right ventricular hypertrophy: R >1 mV in V1, R/S >1 in V1, R/S <1 in V4, V5, V6, right atrial hypertrophy, and right axis deviation 153. (B) New electrode placement ECG from the patient shown in figure 6A, QRS axis 155; findings are identical to the standard.

