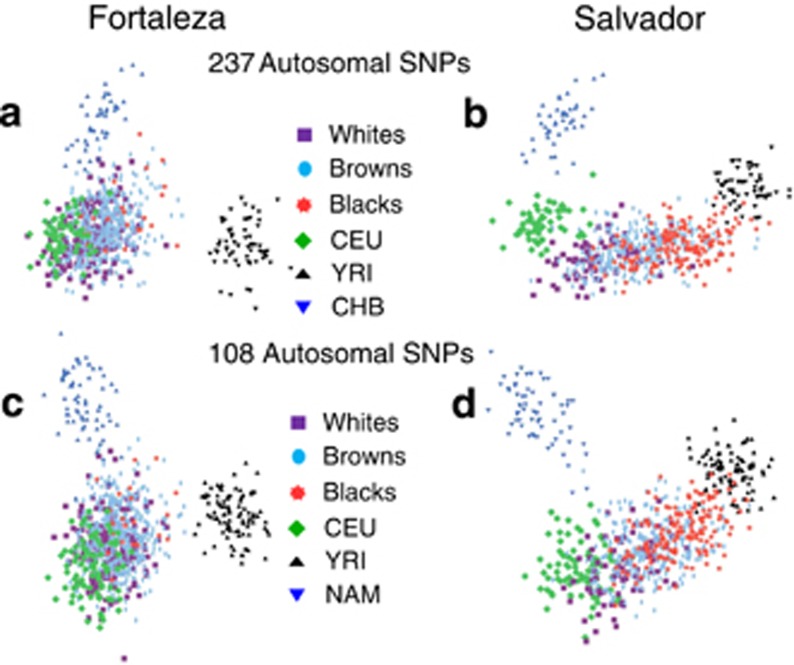
Figure 2.
Comparison of ancestry estimates including an Asian or Amerindian population. Graph of principal component 1 (horizontal axis) versus principal component 2 (vertical axis) for 237 unlinked autosomal SNP markers when the CHB HapMap population was included (a, b) or 108 SNPs with the Amerindian population (c, d). Brazilian populations: whites are shown as purple squares, browns as light blue ovals and blacks as red stars. Pseudoancestors: CEU are shown as green diamonds, YRI as black triangles and CHB or Amerindian as dark blue inverted triangles.

