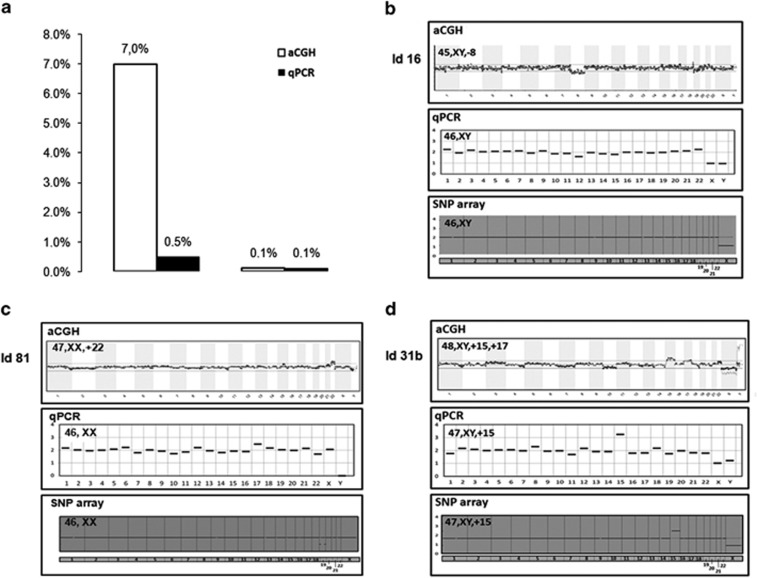
Figure 2.
Profile plot comparison of some discordant cases between aCGH and qPCR with confirmation of diagnosis performed on a third biopsy and SNP array-based CCS. (a) False-positive and -negative chromosome error rates according to CCS methods under investigation. (b) Profile plots of aCGH showing a monosomy for the chromosome 18 for that embryo, shown to be normal by qPCR and SNP array-based CCS follow-up analysis. (c) aCGH profile plot consistent with a trisomy for chromosome 22 for that embryo, shown to be normal by qPCR and SNP array-based CCS follow-up analysis. (d) Profile plots of aCGH showing a double trisomy for chromosome 15 and 17 for that embryo, shown to be trisomy 15 by qPCR and SNP array-based CCS follow-up analysis.

