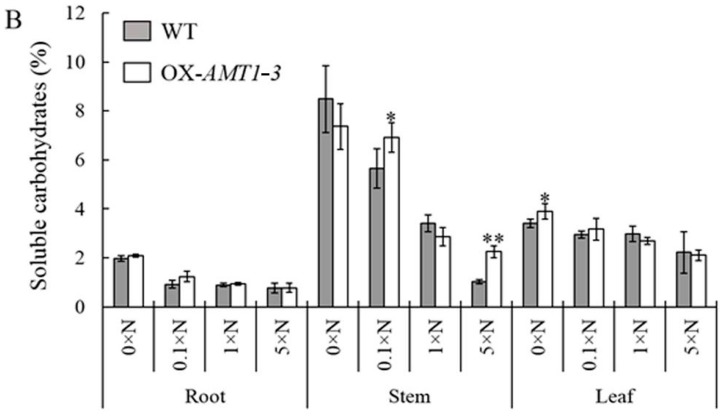
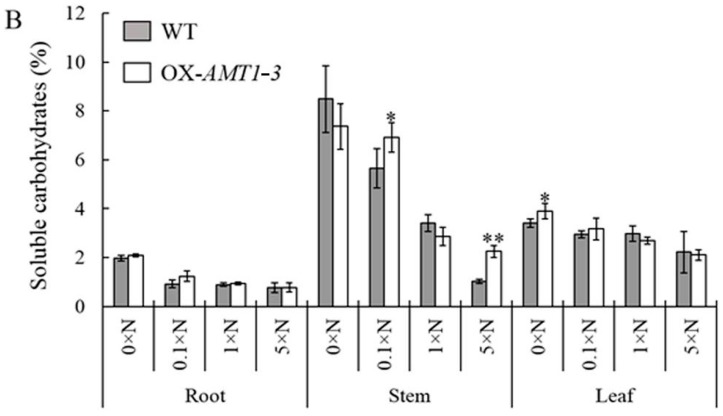
Figure 6.
Soluble carbohydrates analysis. The concentration of soluble carbohydrates in the roots, stems and leaves of the AMT1-3-overexpressing plants (we renamed 3–39 as OX-AMT1-3) and wild type plants (WT) at the tillering stage (A) and the heading stage (B) under 0× N, 0.1× N, 1× N and 5× N conditions. Values are the mean ± s.d. from three biological replications. *, ** indicate the significant differences at the level of p = 0.05 and p = 0.01, respectively.


