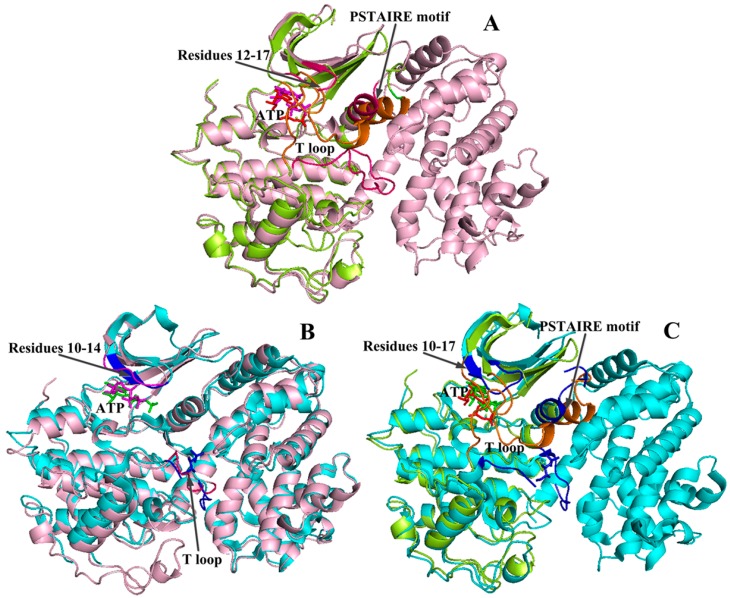
Figure 9.
Comparison of the CDK2 conformation changes in free, partially and fully activated states. (A) Structural superposition of free and partially activated CDK2 complexes; (B) The alignment of partially and fully activated CDK2 complexes; (C) Structural superposition of free and fully activated CDK2 complexes. The yellow, pink and cyan patterns indicate the monomeric CDK2 (free state, coordinates 1HCK), CDK2/cyclin A complex (partially activated form, 1FIN) and phosphorylated dimer (fully activated state, 4EOM), respectively. The changed conformations of monomeric CDK2, CDK2/cyclin A complex and phosphorylated dimer are colored in orange, magenta and blue, respectively.

