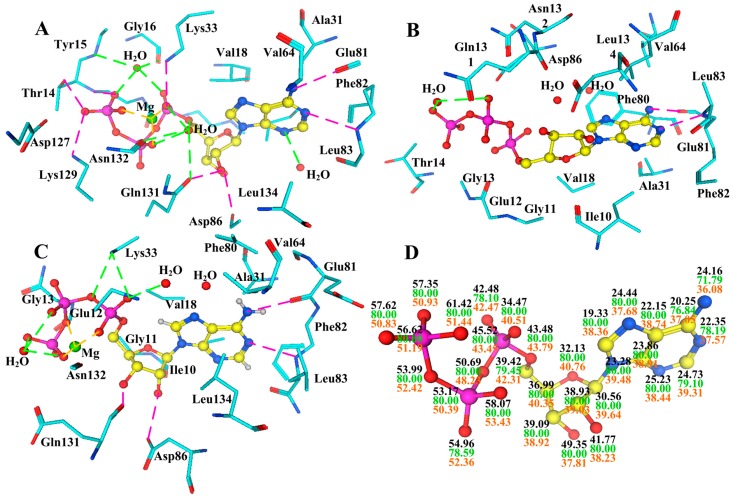
Figure 11.
Variations of the ATP binding site through conformational fluctuations. (A) is the interaction network of ATP in monomeric CDK2 (coordinates 1HCK, resolution 1.9 Å); (B) is in CDK2/cyclin A dimer (1FIN, 2.3 Å); (C) is in the phosphorylated dimer (4EOM, 2.3 Å), respectively; (D) The B-factor (Å2) distribution for the ATP atoms across the monomeric CDK2 (in black font) CDK2/cyclin A complex (in green) and phosphorylated dimer (in red).

