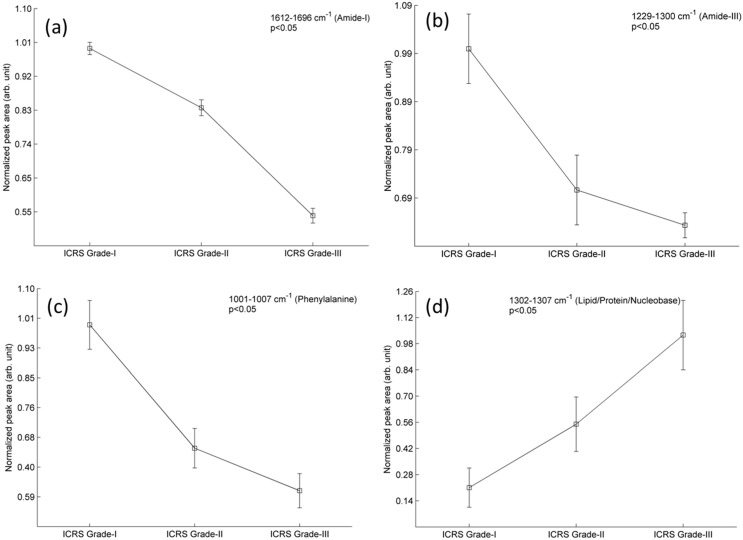
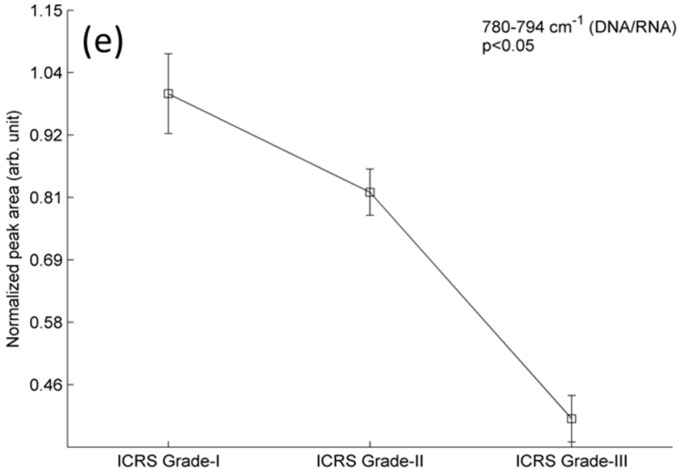
Figure 2.
A relative comparison for the content of amide-I (a); amide-III (b); phenylalanine (c); lipid (d); and DNA/RNA (e) in osteoarthritic chondrocytes (n = 150 cells). These chondrocytes were isolated from osteoarthritic cartilage section of ICRS Grade-I, II and III. Data represents the normalized mean area of Raman band and bar represents the standard error.


