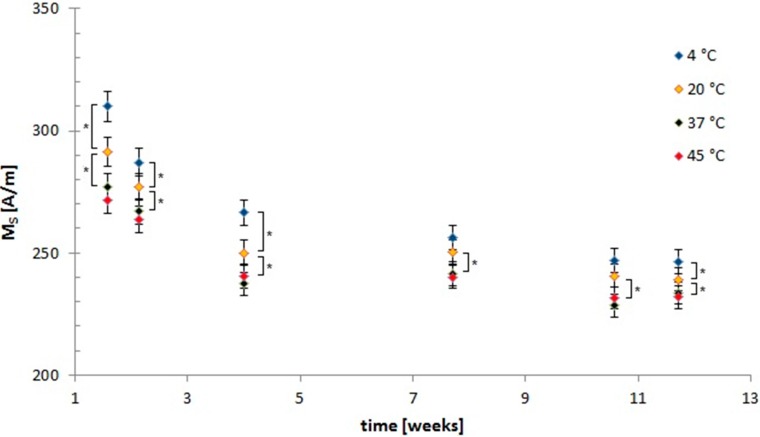
Figure 3.
Changes in saturation magnetisations over time. Saturation magnetisation (Ms) of SEONLA–BSA suspensions after storage at different temperatures are given depending on the storage time. The time points are given as weeks after synthesis. Values are displayed as mean ± standard deviation. All measurements were performed in triplicates. The asterisks mark significance levels that were determined using a paired t-test (* p < 0.05).

