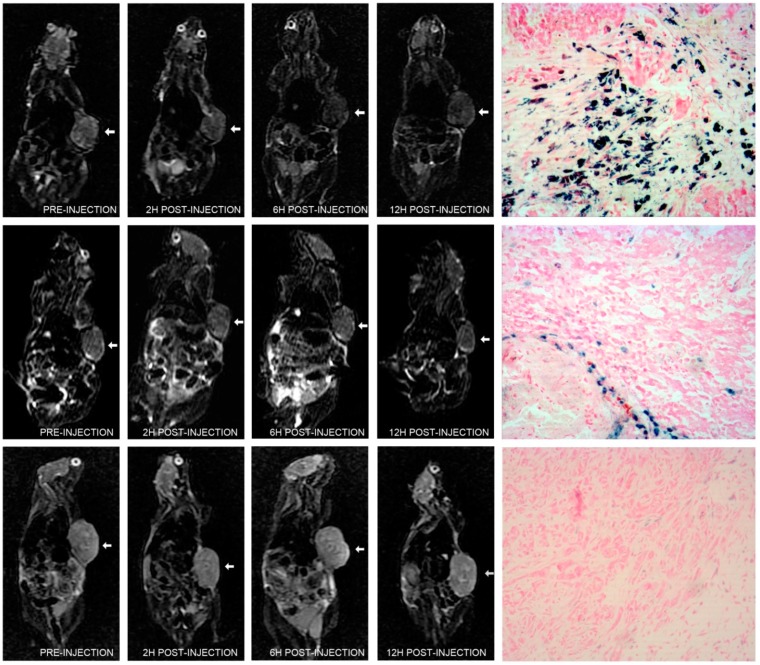
Figure 4.
In vivo MRI images and histologic results. (Top panel) T2 weighted images of LNCaP tumor (arrow) pre-injection, different time point post-injection of polypeptide-SPIONs (Fe3O4, 0.240 mg/mL) and corresponding Prussian blue staining results (×100); (Middle panel) T2 weighted images of LNCaP tumor (arrow) pre-injection, different time point post-injection of non-targeted SPIONs (Fe3O4, 0.240 mg/mL) and corresponding Prussian blue staining results (×100); (Bottom panel) T2 weighted images of PC3 tumor (arrow) pre-injection, different time point post-injection of polypeptide-SPIONs (Fe3O4, 0.240 mg/mL) and corresponding Prussian blue staining results (×100).

