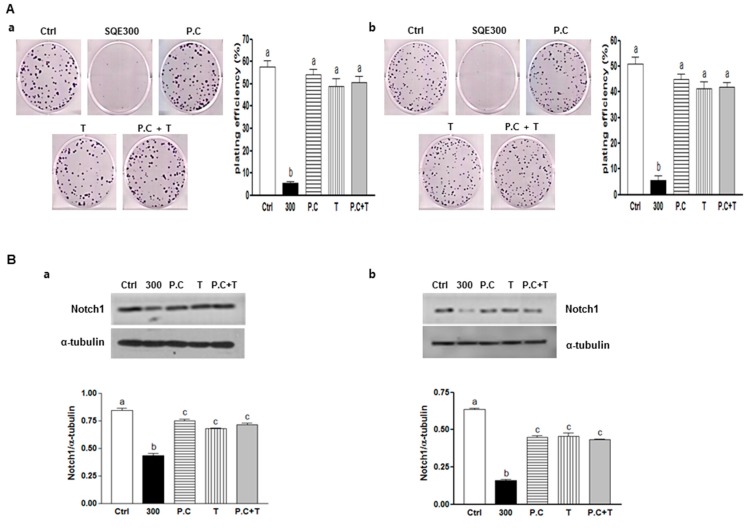
Figure 7.
Effect of combination of p-coumaric acid and tricin on clonogenicity and stem cell marker, Notch1. CD133+CD44+ HT29 cells (a) and CD133+CD44+ HCT116 cells (b) were treated with SQE (300 μg/mL), p-coumaric acid (1.8 μM), tricin (0.7 μM), or combination of p-coumaric acid (1.8 μM) and tricin (0.7 μM). (A) After eight days, the resulting colonies were fixed and stained. Microscopy images of colony formation were obtained (magnification, 100×, left panel) and the number of colonies was recorded (right panel). Plating efficiency (%) = (number of colonies)/(total cell number) × 100; (B) Levels of protein expressions for Notch1 was examined by Western blot analysis, and detection of α-tubulin was used as a loading control. The letter labels on the histogram indicate the values that significantly differed from each other (p < 0.05) according to one-way ANOVA for multiple comparisons. Ctrl, Control; SQE, Sasa quelpaertensis extract; P.C, p-coumaric acid; T, tricin.

