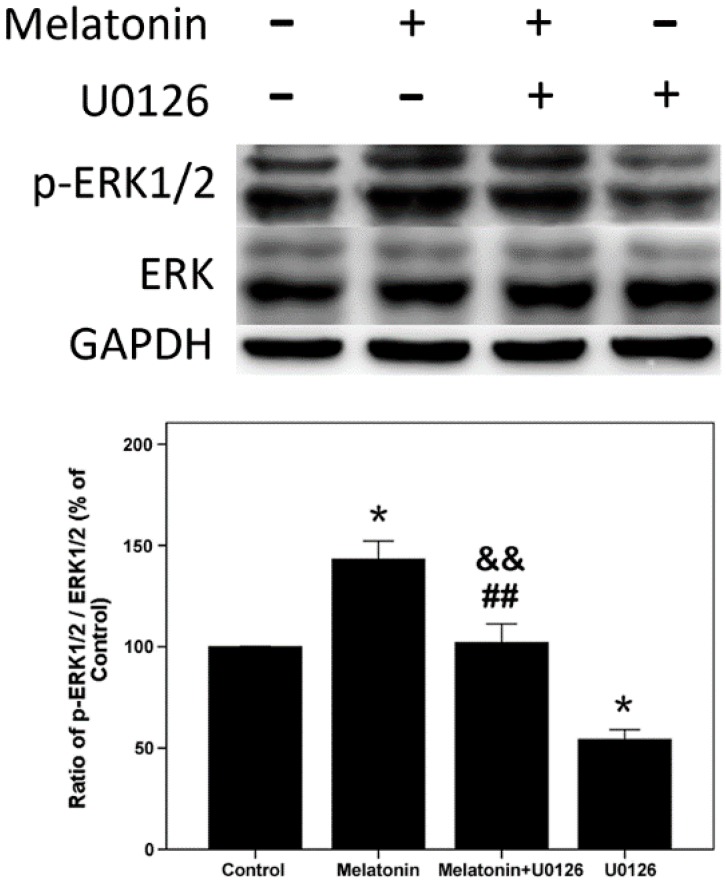
Figure 3.
Expression of p-ERK1/2 induced by U0126 (20 µM), melatonin (10 µM) alone and both of them in hFOB 1.19 cells for 24 h. Total and phosphorylated (p-) expression levels were measured by Western blot. The results are represented as the ratio of p-ERK1/2/ERK1/2. Expression levels were normalized by GAPDH first. Each bar is indicated as the relative percentage of control cells. The results are represented as the means ± SEM of three independent experiments. * p < 0.05, compared with control cells; ## p < 0.01, compared with the melatonin treatment group; && p < 0.01, compared with the U0126 treatment group.

