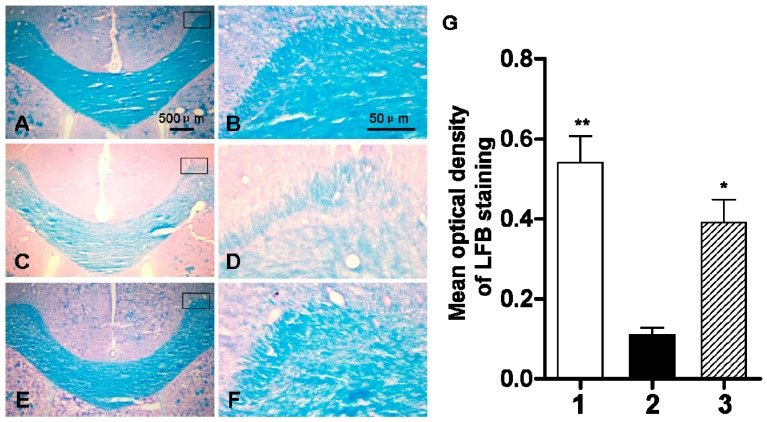
Figure 7.
The changes of myelin development by myelin specific LFB staining three days after hypoxic-ischemic injury. (A,B) sham-operated group; (C,D) ischemic and hypoxia group; (E,F) administration of DIDS at 1 h after injury; (G) Quantification of LFB staining by optical density. Well 1: sham-operated group. Well 2: ischemic and hypoxia group. Well 3: administration of DIDS at 1 h after injury. Values presented as means ± S.E.M. (n = 5), * p < 0.05; ** p < 0.01 vs. ischemic and hypoxia group.

