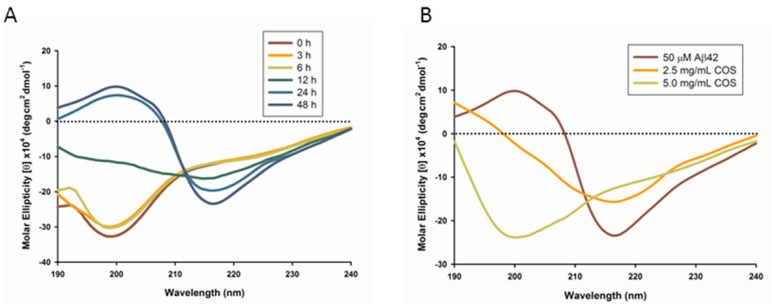
Figure 1.
Circular Dichroism (CD) spectroscopy of Aβ42. Amyloid-β (Aβ) peptides were diluted with 10 mM phosphate buffer to a final concentration of 50 μM in each sample. (A) CD spectra of Aβ42 upon incubation were recorded in the UV region (190–240 nm) at 0, 3, 6, 12, 24 and 48 h respectively; (B) CD spectra of 50 μM Aβ42 were recorded in the UV region (190–240 nm) upon coincubation with 2.5 or 5.0 mg/mL chitosan oligosaccharides (COS) (when present) respectively for 48 h. Data were the average of six runs and represented as rainbow color curves after being smoothed.

