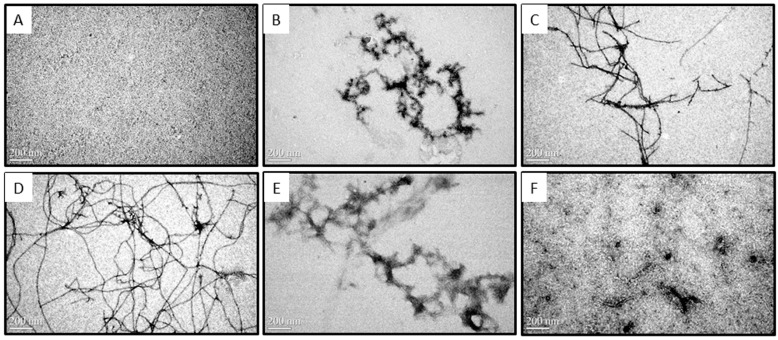
Figure 2.
Effect of COS on Aβ aggregates visualized by Transmission Electron Microscopy (TEM). Representative TEM images of monomeric Aβ42 fractions soon after preparation (A) and fibrils formed by monomeric Aβ42 after 12 h (B), 24 h (C), and 48 h (D) of incubation at 37 °C (10 μM Aβ42, without agitation); Representative images of monomeric Aβ42 (10 μM) coincubated with 0.5 mg/mL (E) or 1.0 mg/mL COS (F) for 48 h at 37 °C were visualized by TEM. The scale bar (200 nm) is shown in the lower left of the images. Magnification: 80,000×.

