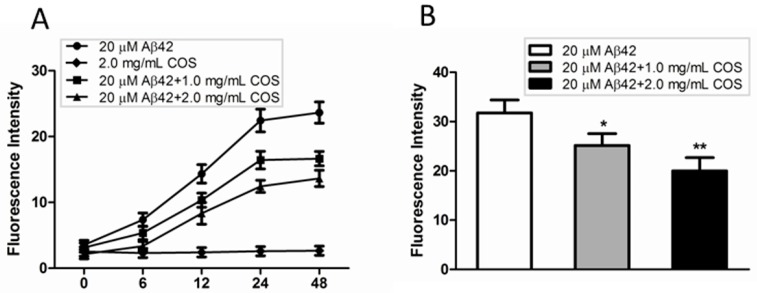
Figure 3.
Effect of COS on Aβ fibrils formation. (A) Time-dependent thioflavin T (ThT) fluorescence intensity changes for 20 μM Aβ42 incubated with different concentration of COS (1.0 and 2.0 mg/mL respectively), as compared to 2.0 mg/mL COS or 20 μM Aβ42 alone; (B) Disaggregative effect of COS (1.0 and 2.0 mg/mL respectively) on preformed Aβ fibrils. Data were represented as mean ± SEM of three independent experiments. ** p < 0.01, * p < 0.05 vs. Aβ42 alone.

