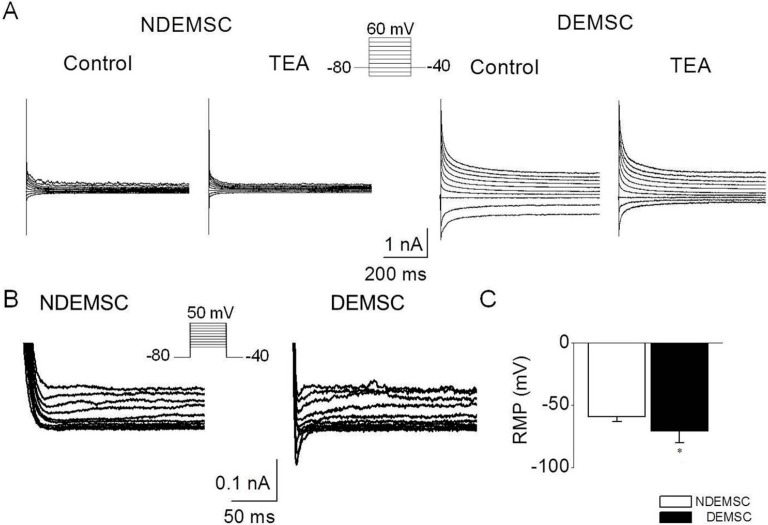
Figure 4.
Electrophysiological analysis of porcine EMSCs and neuronal DEMSCs. (A) Comparison of K+ currents between undifferentiated EMSC (NDEMSC) and differentiated into neurogenic cells (DEMSC). Membrane currents were recorded with the 600-ms voltage steps as shown in the inset in the absence and presence of 3 mM TEA (n = 30); (B) Representative traces of Na+ currents obtained in NDEMSC and DEMSC. Voltage-dependent Na+ currents were recorded in DEMSC in response to 100-ms voltage steps (n = 30); (C) Comparison of resting membrane potential between NDEMSC and DEMSC. Each bar represents the mean ± SD. The (*) indicates a significant difference from the NDEMSC (p < 0.05).

