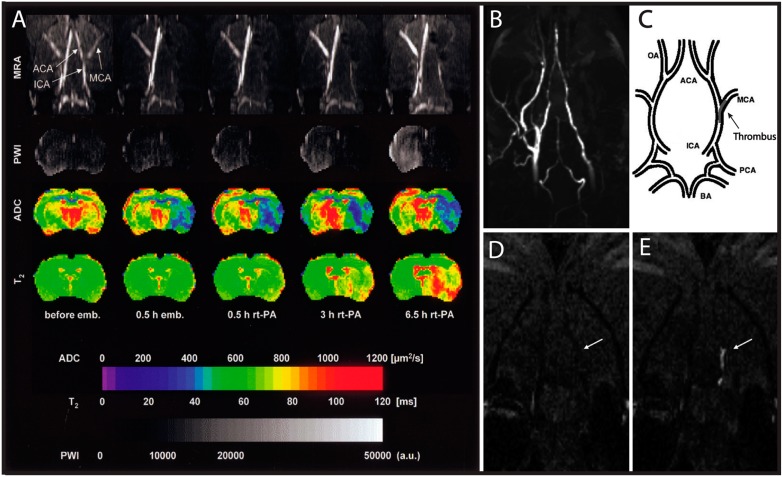
Figure 6.
MRI of Thromboembolic Stroke in a Rat Model. (A) Multiparametric MRI of rat brain before and after intracarotid clot embolism treated at 1 h with intra-arterial infusion of recombinant tissue plasminogen activator (rt-PA). MRA of horizontal maximum-intensity projection maps focusing on the Circle of Willis; PWI, perfusion-weighted imaging; ADC, apparent diffusion coefficient of water; T2, mapping of T2 relaxation time; (B) Coronal maximum intensity projection of TOF-MRA shows right-sided flow deficit; (C) Pictorial representation of the location of the thrombus within the cerebral arterial tree. Coronal slice from 3D T1-weighted images at level of the middle cerebral artery (MCA) origin: the EP-2104R enhanced image (E) clearly identifies the thrombus (arrow) that was not visible on the image acquired before EP-2104R injection (D). Subfigure A is reproduced with permission from Hilger et al. [152], whereas subfigures B–E are reproduced with permission from Uppal et al. [45].

